Investment constitutes a key component of economic growth. Considering the fact that investment is mostly carried out by the private sector, analyzing the investment behavior of firms helps to understand the basic dynamics of economic growth and to design the relevant policies more effectively. With this in mind, we examined investment behaviors of manufacturing industry firms registered in the Enterprise Information System (EIS) of Ministry of Science, Industry and Technology by analyzing balance sheets and income statements for the period of 2006-2016. This unique data set provides a breakdown of capital goods by type, such as machinery and equipment, construction and vehicles for about 325 thousand firms that adds up to 1.6 million observations. After data cleaning, 261,300 firms and 1.2 million observations were included in the base sample for analysis. This new sample represents more than 90 percent of total assets and fixed capital stocks of all the firms recorded in the raw data.
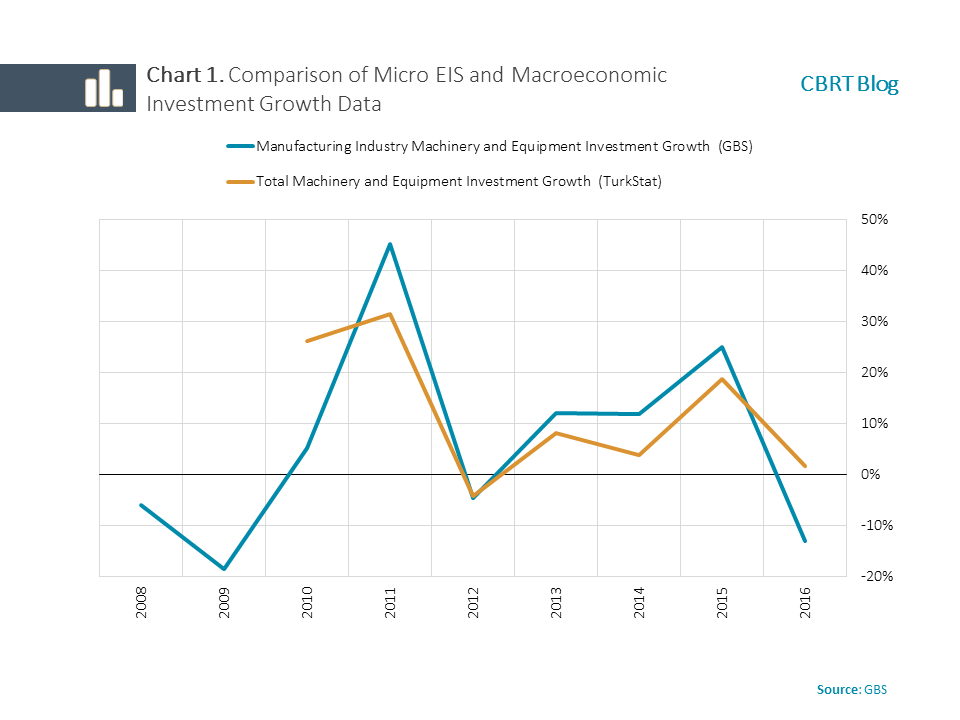
The main variable of the analysis, investment rate, has been calculated as the ratio of real investments to real net sales, in line with the economic literature.1 Real investment is defined as the change in the nominal capital stock that is deflated by the capital goods price index 2 , and the real net sales is computed by deflating the net sales by the two-digit sectoral producer price index. 3 Before proceeding with the analysis, we present an overview of the concordance of investment calculated using EIS data with the official macroeconomic investment series published by the Turkish Statistical Institute (TurkStat) in Chart 1. As shown in the chart, the growth figures in plant-machinery-equipment 4 investments in manufacturing industry calculated from the EIS and total machinery-equipment calculated from TurkStat data, move together.5
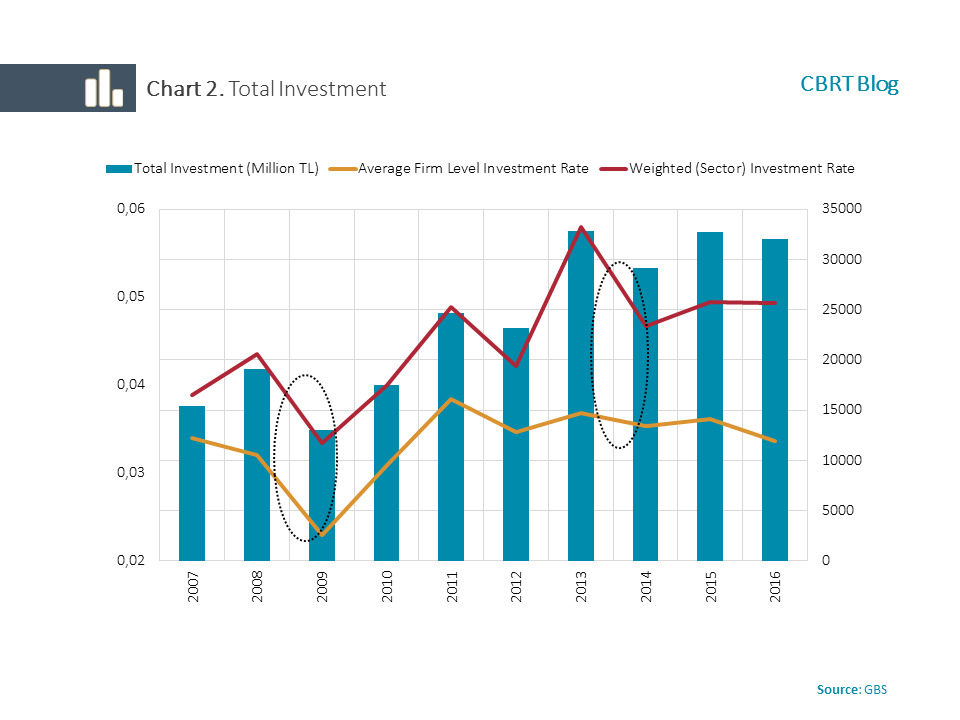
It is evident from Chart 2 that total firm investments were generally on the rise between the 2007-2016 period, with short-term declines in some years. These declines happened (1) in 2009 when the global financial crisis took a toll, (2) in 2012 when the debt crisis emerged and (3) in 2014 when emerging economies including Turkey witnessed interest rate hikes and exchange rate fluctuations in response to the Fed’s tapering its asset purchases. Additionally, it should be noted that geopolitical developments by the end of 2013 and beyond were also instrumental in these declines. The orange line in Chart 2 shows the average firm investment rate, while the red line shows the sector weighted investment rate by net sales. Due to the large number of small firms in the manufacturing industry, the average firm investment rate is dominated by the tendencies of small firms, and similarly, the sector investment rate rather reflects the trend of relatively larger firms. Accordingly, after 2011, investment rates for large firms generally increased, whereas those for small firms posted a limited decline.
A breakdown of investment by capital types highlights that the decline in the average investment rate for machinery and equipment is more discernible compared to the total investment (Chart 3). Accordingly, it can be asserted that one of the reasons behind the fall of total investments by small firms is the decline in machinery and equipment investments.

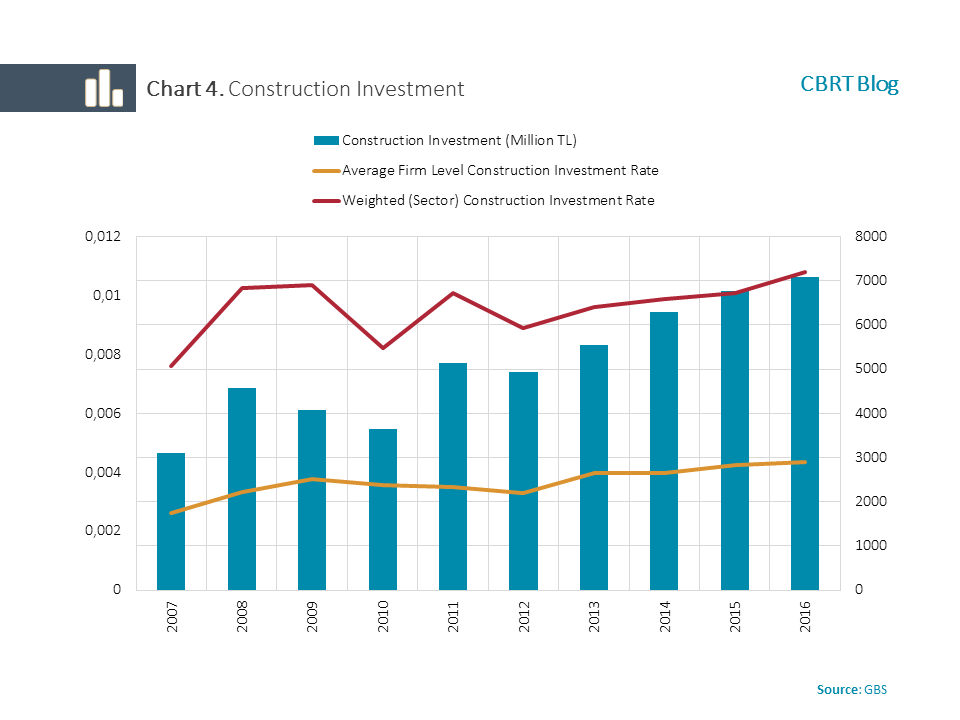
In contrast to the other capital types, investment rates for non-residential construction have been on the rise since 2011 both on sector and average bases (Chart 4). This observation may be due to firms’ tendency towards investing in real estate to benefit from increasing asset prices, which is in accord with the general construction investment trend shown by the macroeconomic data.
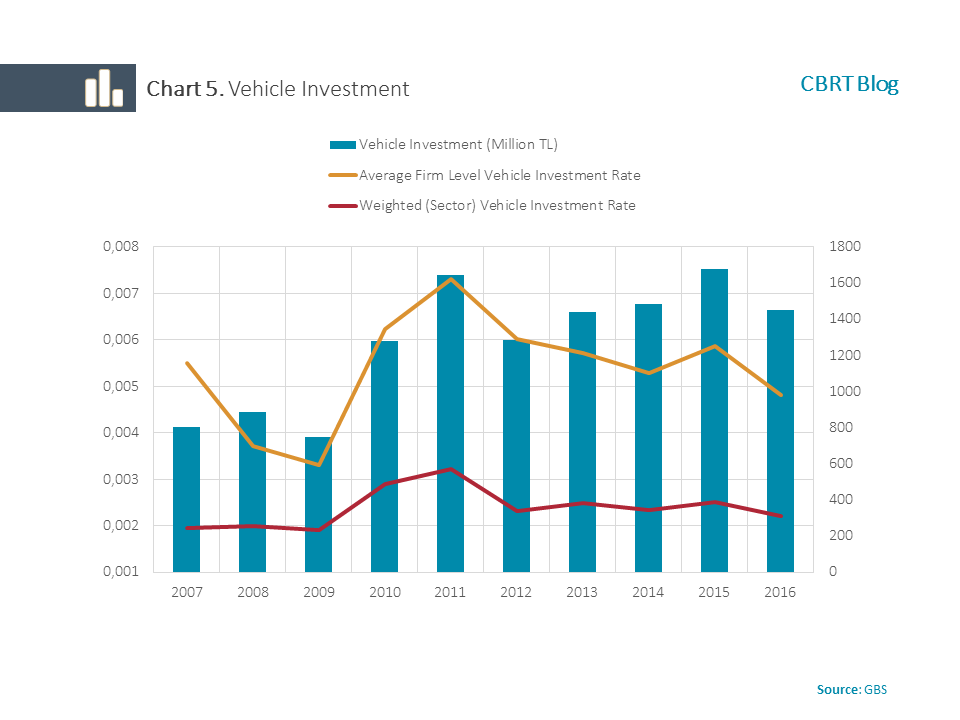
As for the vehicle investment rate in the manufacturing industry, it is noteworthy that the average firm level investment rate is well above the industry average (Chart 5). This is to say that small firms have a significant share of capital expenditures made on vehicles among all other capital types. However, in the post 2011 period, while the sector investment rate remained relatively stable, the average vehicle investment rates declined. This finding signals that while the share of vehicle investments by small firms decreased, no significant change was observed on the side of large firms. The decline in the vehicle investment rate by small firms may be explained by the hike in the special consumption tax in post-2011.
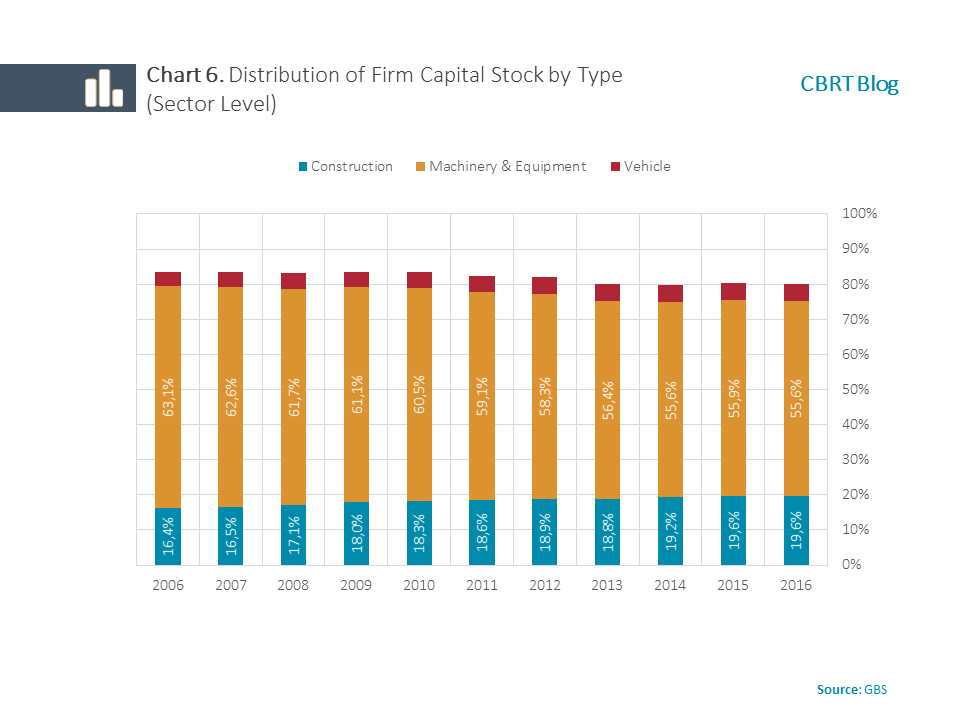
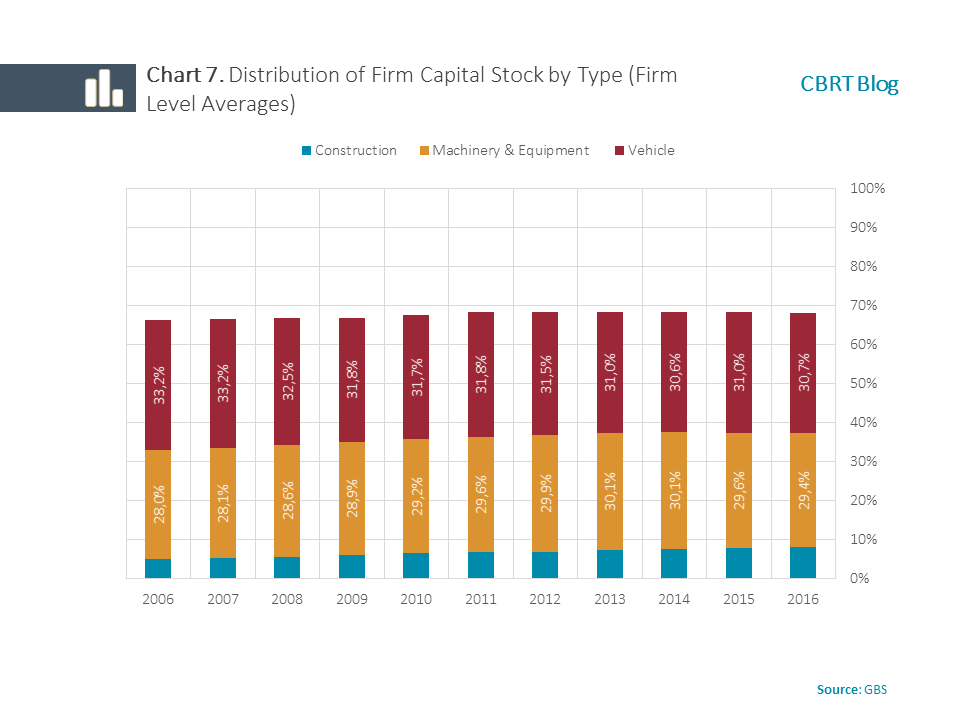
Besides the general trend of the investment rate, the share of machinery and equipment, construction, and vehicles within the total capital stock is also important to understand the production structure. Considering the sector as a whole, more than half of the total manufacturing industry capital is composed of machinery and equipment, albeit with a diminishing share over time (Chart 6). On the other hand, firm level average share of machinery and equipment – computed as the share of their capital sub-items– is below one third, while the averages of share of vehicles is around one third of the capital (Chart 7). A comparison of the two charts shows that the machinery and equipment constitutes the main component of the capital stock of large firms, whereas it is the vehicle stock for small firms.
Understanding the reasons for small manufacturing firms’ allocating a significant portion of their limited capital to vehicles gives an insight into grasping the sector’s dynamics. For instance, registration of family vehicles for personal use as a firm investment due to the tax advantage and prestige related concerns can be cited as possible explanations. As a matter of fact, small firms’ vehicle investments started to trend down after the relative increase of the special consumption tax on passenger cars in the post-2011 period, which supports this assertion (Chart 5). In the light of these findings, while devising incentives for small firms, it would be beneficial to promote policies that particularly boost the machinery and equipment investments.
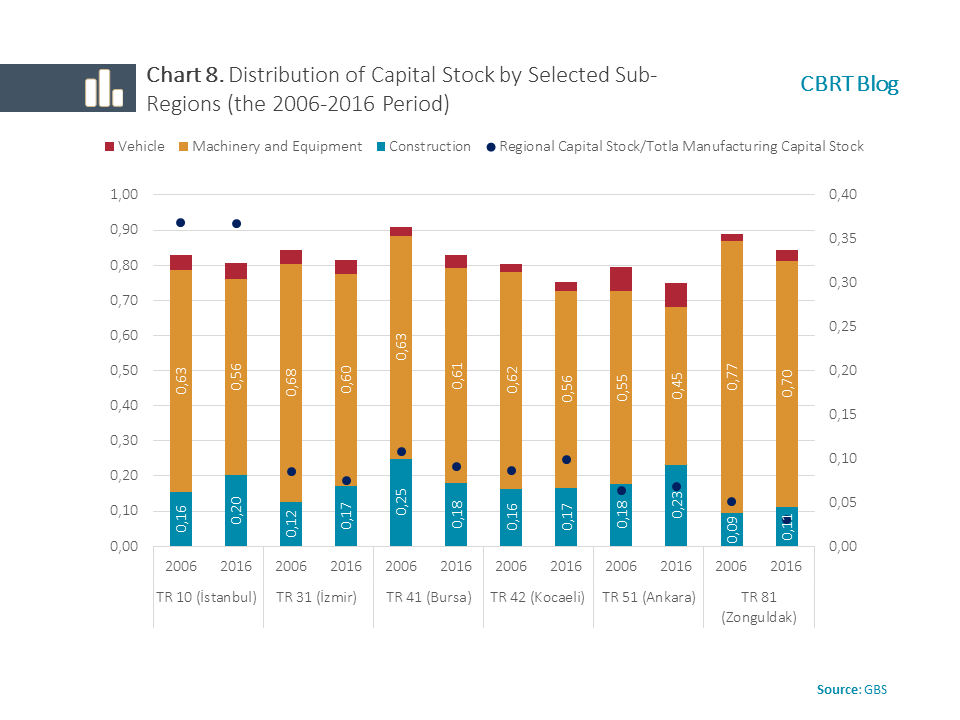
Analyses regarding six NUTS 2 regions, whose share in the manufacturing industry total capital stock was 5 percent and above as of 2006, are given in Chart 8. Dark blue dots show the share of the related region’s total capital stock in the manufacturing industry total capital stock of the respective year. Regardless of their production location, the majority of firms is headquartered in Istanbul, hence the largest capital stock share belongs to Istanbul with 37 percent and this share has stayed constant over the past 10 years. Istanbul is followed by Bursa and Kocaeli regions. While the share of construction stock increased in all regions, manufacturing industry construction stock displayed a significant decline in Bursa. Machinery and equipment stock decreased in all regions, with the most evident decrease seen in Ankara region which has the lowest stock level. Meanwhile, Ankara region stands out with the largest vehicle stock in manufacturing industry. A similar distribution has also been calculated for regions with a share of 1 to 5 percent in the total manufacturing industry capital stock as of 2006. Accordingly, the regions that recorded the highest increases in their shares of manufacturing industry capital stock during the past 10-year-period were Tekirdağ, which is an important production center for Istanbul firms, along with Konya, Hatay and Gaziantep, which have recently developed significantly and received massive immigration, primarily from Syria. An analysis of the distribution by the type of capital goods indicates that while the stock shares of machinery and equipment declined, those of construction capital increased.
Firm investment rates have recently diverged in Turkey. Investments of large firms, predominant in the industry, have increased more rapidly than their sales, whereas those of small firms have been on the decline. The decline in investments of small firms might be attributed to a variety of reasons. The major ones cited in the related literature are decreased profitability of firms and difficulties in access to finance. In this sense, it is important to support accessibility of productive small firms to investment loans.
In the meantime, considering the vehicle-oriented propensity to spend, it would be appropriate to focus on policies that can directly encourage machinery and equipment investments, while designing incentives for small manufacturing industry enterprises. It should be noted that the increase in construction investments, as evident from region-based analyses, moves in tandem with macroeconomic trends of the construction sector in Turkey. In sum, incentive policies should be designed in such a way as to aim for mechanization, particularly R&D-backed and high tech-based mechanization, in manufacturing industry in the long run, by taking into account differences in the breakdown of investments.
Bibliography:
F., Manaresi and N., Pierri, 2017. "Credit Constraints and Firm Productivity: Evidence from Italy," Mo.Fi.R. Working Papers 137, Money and Finance Research group (Mo.Fi.R.) - Univ. Politecnica Marche - Dept. Economic and Social Sciences.
K., Farla, 2014. "Determinants of firms' investment behaviour: a multilevel approach," Applied Economics, Taylor & Francis Journals, Vol. 46(34), pages 4231-4241.
O., Lamont, O. 1997. "Cash Flow and Investment: Evidence from Internal Capital Markets. The Journal of Finance, 52: 83-109".
S., Kalemli-Ozcan and L., Laeven and D., Moreno 2018. "Debt Overhang, Rollover Risk, and Corporate Investment: Evidence from the European Crisis," NBR Working Paper Series No. 24555.
i In the related literature, although investment rate is calculated as the growth of real capital stock (for instance Kalemli-Özcan et al. (2015)), this approach might lead to some biases in cases where it is not possible to soundly calculate the first year value of the capital stock. The related literature, therefore, defines investment rate as the ratio of investments to net sales as an alternative approach to overcome these difficulties (Lamont (1997) and Farla (2014)). According to the latter approach, the first year real replacement (market) value of the capital stock is calculated under certain assumptions thereby obtaining a real capital stock through the perpetual inventory method and the investment rate is calculated as the growth of this real capital stock (For instance Manaresi and Pierri (2017)). The investment rate calculated with the current method (investment-net sales ratio) used in our study exhibits qualitative tendencies similar to the other two methods mentioned above.
ii The main assumption in this approach is that firm balance sheets are exempted from cost accounting (inflation adjustment). This assumption complies with the relevant accounting standard. As a matter of fact, the Regulation No 5228 of June 2004 ceased the practice of inflation adjustment to firm balance sheets from 2004, when the balance sheets were adjusted for inflation for the last time, and stipulated certain conditions for inflation adjustments to be implemented in the following years. These conditions, however, did not materialize between 2006 and 2016.
iii We processed with total investment and machinery and equipment investment accounts as explained above. While converting construction and vehicle investments into real terms, we used Construction Cost Index, and the Motor Vehicles Index sub-item of the CPI, respectively.
iv In this study, capital investment and stock definitions have been obtained from the information reported in current firm balance sheets. According to the scope of balance sheet accounts, “252 Buildings Account” comprises business administration buildings and building types other than production facilities such as education, health, recreational facilities and buildings used for storage purposes. The “253 Plant, Equipment, Machinery and Tools Account” covers all facilities, equipment, machines, and tools used for production purposes. Finally, the “254 Vehicles Account” includes all types of land, water and sea vehicles and air vehicles.
v Minor differences between trends can be attributed to the fact that total machinery and equipment investments in the TurkStat data are inclusive of all sectors. Although macro series are not published exclusively for the manufacturing industry, the majority of the machinery and equipment investments belongs to the manufacturing industry firms, which reduces the differences.