The C index is used as an indicator of core inflation and is obtained by excluding food, energy, and alcoholic beverages and tobacco products from the consumption basket. The remaining items can be categorized into core goods and services groups. Combining these two groups, the C index has the characteristics that a core inflation indicator should have, yet it differs across core goods and services groups in many terms. In this blog post, we focus on the differences between the pricing dynamics of core goods and services groups from a central banking perspective. Similar to the inflation accounting in Kara et al. (2017), deriving from the contribution of macro variables such as exchange rate, import prices, output gap, and real unit wages to core goods and services inflation, we want to draw attention to the differences between pricing behaviors of these two groups. We build our econometric model based on a small open economy Phillips Curve. It is a given fact that different methods may produce different results but we should indicate that these results are also consistent with CBRT’s other studies and our economic intuition.
The exchange rate stands out as the key determinant of core goods inflation dynamics. The average contribution of this variable to core goods inflation was approximately 5 percentage points in the years between 2009 and 2017 (Charts 1 and 2). Likewise, studies by the CBRT staff demonstrate that the exchange rate pass-through in the core goods group is stronger than in overall consumer prices. On the other hand, the role of demand conditions and wages in core goods inflation dynamics is rather limited. This is an economically reasonable outcome considering that the production of core goods is relatively less labor-intensive and involves a high ratio of imported input use. In this respect, the cumulative depreciation of the Turkish lira was the leading factor in the 15.5 percent core goods inflation in 2017. In fact, a significant exchange rate effect was also observed back in 2015 but the TL-denominated cost pressure (exchange rate and import prices) was contained to some extent as import prices decreased in line with oil prices. However, we estimate the total effect of exchange rates and import prices on core goods inflation to be around 10 percentage points in 2017 as import prices also followed an inflationary course.
The output gap, another variable in our model, does not have a historically significant effect on core goods inflation due to the convergence of its long-term average to zero. However, the negative output gap of 2016 had a downward effect on inflation whereas demand conditions exerted additional pressure on inflation in 2017. Meanwhile, real unit wages pushed up core goods inflation due to recent rapid wage increases that were not covered by productivity increases. While the historical average contribution of tax adjustments to core goods inflation is 0.2 percentage points, it reached 1.1 percentage points in 2017. In this context, we see that a large portion of the fluctuations in core goods inflation can be explained by macro variables. Accordingly, considering that the effect – also called inflation inertia – is calculated as relatively low as 1.7 percentage points in this group, we estimate that core goods inflation may rapidly fall to very low levels in the absence of cost and demand shocks.

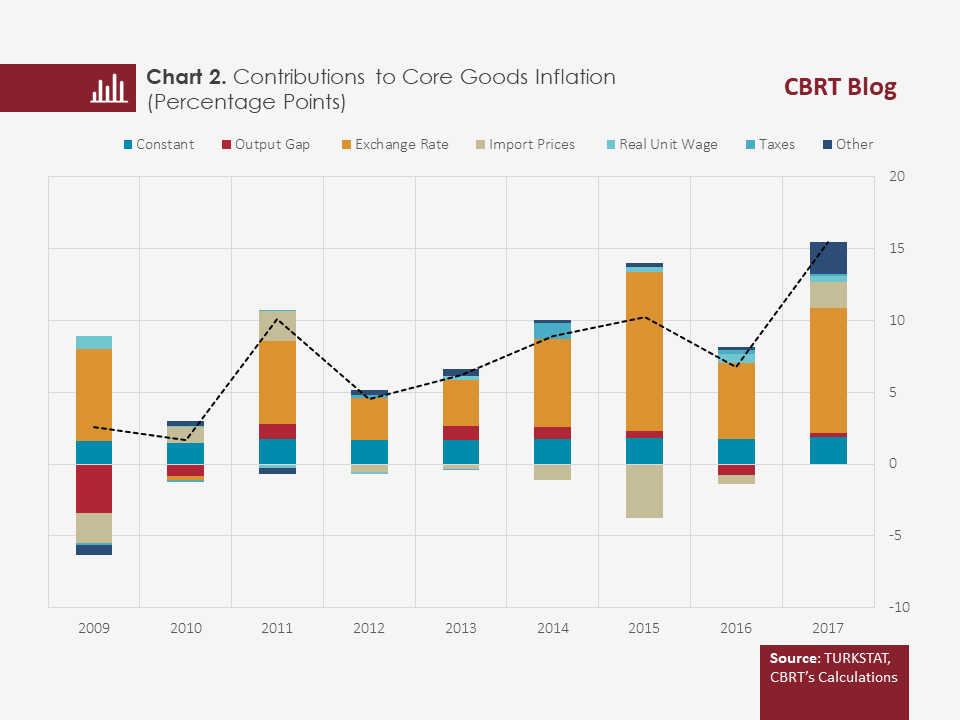
Another point we want to discuss is that the variables in the forecast model remain relatively weak in explaining the changes in core goods prices in 2017 compared to previous years. We have derived this judgment based on the error terms of the model, and it may be due to certain factors that were not included in the model but affected core goods inflation throughout the period in question. For example, effects of customs duty adjustments that cannot be included in the model, the rise in expectations for headline inflation and for the depreciation in the Turkish lira, or a change in the pricing behavior can be among these factors. In addition, it is probable that demand conditions for goods such as white goods and furniture subject to tax reduction have been stronger than demand conditions implied by the output gap estimated for the overall economy.
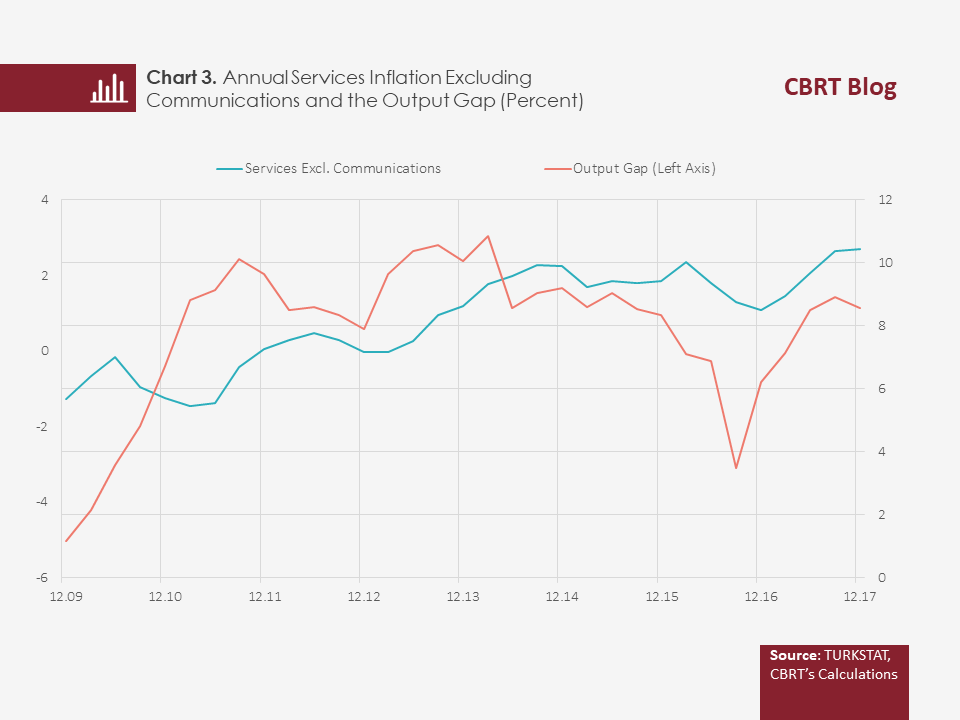
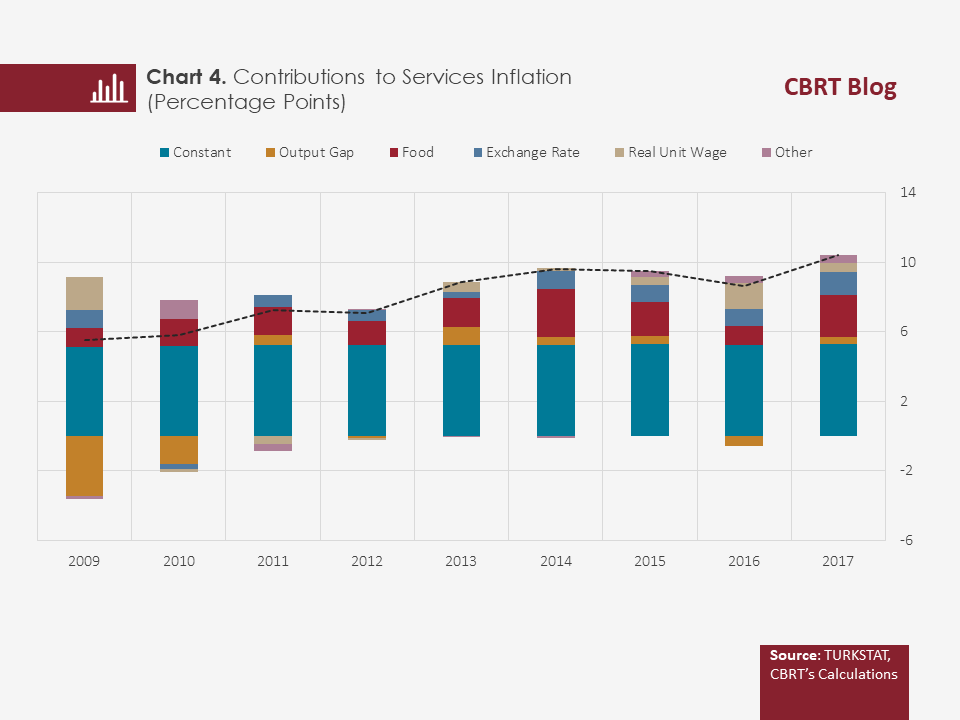
We also analyze services inflation dynamics from a similar perspective. For a clearer picture, we exclude the communications sector whose pricing behavior and inflation rate diverge from the overall services sector (Chart 3). Chart 4 shows the contribution of main macroeconomic variables to services inflation excluding communications between 2009 and 2017, and the most striking point in this chart is the historically high inertia in services inflation. Here, inertia refers to inflation that cannot be explained by macroeconomic variables but by structural factors. The inertia in services inflation is 5.2 percentage points, which is quite high compared to core goods inflation. Well, how can we explain this difference between the two main components of core inflation? First of all, the lack of a containing effect of international competitiveness on inflation due to the relatively closed nature of the services sector increases the price adjustment capacity of firms. Moreover, the fact that the services sector is a relatively labor-intensive sector and also the backward-indexation behavior in wage and lease contracts as well as in services like education constitute another factor strengthening the inertia in services inflation. This causes a slow adaptation of services inflation to macroeconomic variables and leads to a persistence in inflation in Turkey.
Another variable making a large contribution to services inflation in the analysis period is food prices, with an average contribution of 1.7 percentage points. Prices in the restaurant-hotel subgroup of the services group are affected by food prices via a number of items associated with catering services (such as meat, tea, bread, beverages, etc.). The exchange rate pass-through to services inflation is much lower than to core goods inflation. The use of imported inputs is relatively low in the services sector, which reduces the exchange rate pass-through. Transport and maintenance-repair services, and the package tour prices are the major exchange rate-sensitive subgroups of the services sector. In 2017, food prices and the exchange rate added to services inflation by 2.4 percentage points and 1.4 percentage points, respectively, both of which were above historical averages.
On the other hand, the total contribution of the output gap and real unit wages is higher in the services group than in the core goods group. This is mainly because the services sector is relatively more labor-intensive. We can say that the impact of unit labor costs on services inflation has increased in the recent period due to the rise in nominal wages and the deceleration in partial labor productivity. This increase was also backed by the improvement in total demand conditions, and the contribution of the output gap to services inflation significantly escalated compared to the previous year. All in all, we estimate that the total contribution of the output gap and real unit wages to services inflation was 0.9 percentage points in 2017. Following these developments, communications-excluded services inflation reached 10.4 percent and ended the year 2017 at a higher level than the average of the 2009-2016 period (7.8 percent).
To sum up, the pricing dynamics of core goods and services groups – the two main components of core inflation – are very different. In the core goods group, which mostly consists of tradable goods, exchange rates and import prices are the major determinants, and inflation inertia is relatively small. However, in the services sector, which is a rather closed sector due to lack of tradability, the pass-through from exchange rates and international prices is lower, yet sensitivity to wages and business cycles are relatively higher. Additionally, inflation inertia is quite high in the services group due to factors such as the wage-price spiral and strong backward-indexation mechanisms. All in all, for a sound analysis of core inflation, we should hear the tales of these two groups individually.
Bibliography
Kara, A. H., F. Öğünç and Ç. Sarıkaya (2017). “Inflation Dynamics in Turkey: A Historical Accounting”, CBRT Research Notes in Economics, 17/03.