
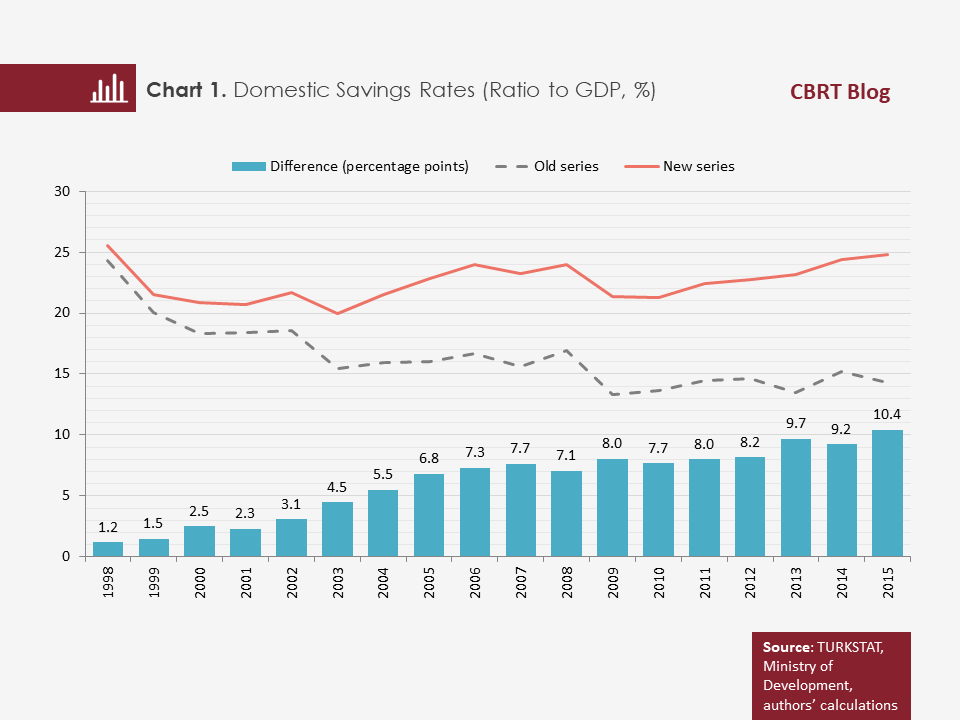
The Turkish Statistical Institution (TURKSTAT) has recently made a revision in the national account system. The revision, which was introduced to harmonize Turkey’s national accounts with the System of National Accounts-2008 (SNA-2008) and the European System of Accounts-2010 (ESA-2010), was also intended to improve calculations by using new data sources.[1] Due to the revision, some differences emerged between the 1998-based old series and the 2009-based new series. One of the most important differences between the series was in savings rates (Chart 1). We observe that savings rates jumped significantly in the new series and the gap between the two savings series widened over the years and reached 10.4 points by 2015. Well, do the markedly high savings rates in the new series mean that the need for structural reforms in this area has weakened? To answer this question, we offer an overall evaluation on the increase in domestic savings rates obtained by using national accounts after the national income revision.
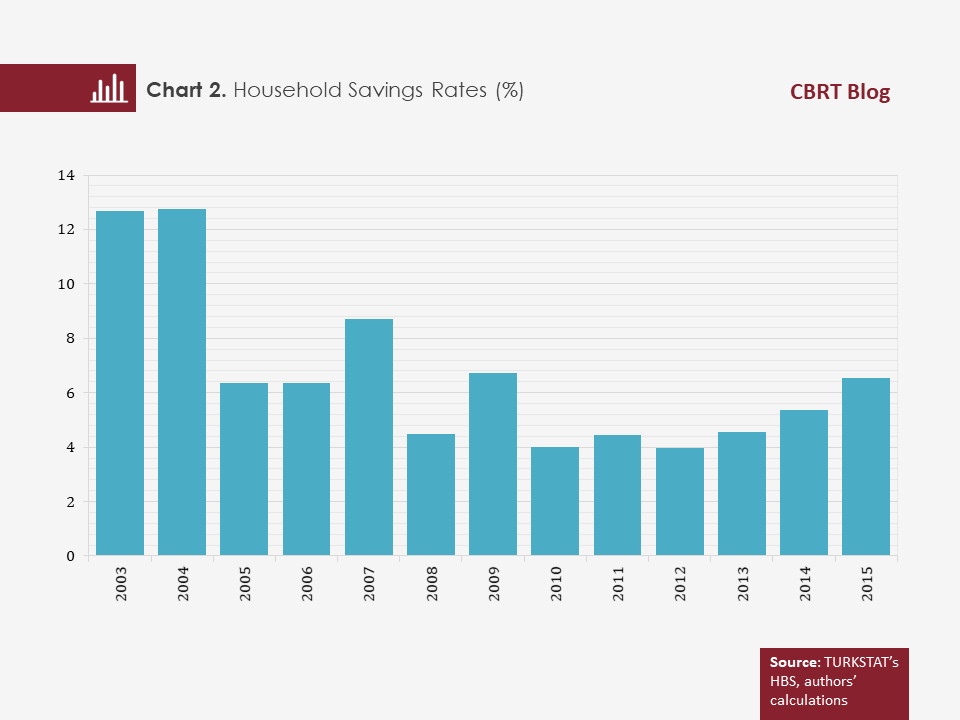
To figure out whether the increase in domestic saving rates revealed by national accounts originated from a behavioral change or simply from a methodological change, we first examine the household savings using a different source. Household savings rates calculated based on micro data from the Household Budget Survey (HBS) were low after 2010, whereas they have been posting moderate increases since 2013 (Chart 2).[2] The relatively high savings rate in 2009 can be interpreted as an indicator of households’ reduced consumption, particularly durable goods consumption, due to the global financial crisis. In the following years, however, the durable goods consumption, which was deferred during the crisis period, picked up again and accordingly, household savings rates dropped. On the other hand, the impact of macroprudential measures introduced to contain household indebtedness levels became visible and a 25-percent state subsidy was introduced in the Private Pension System (PPS), which may have bolstered the increase in household savings since 2013.
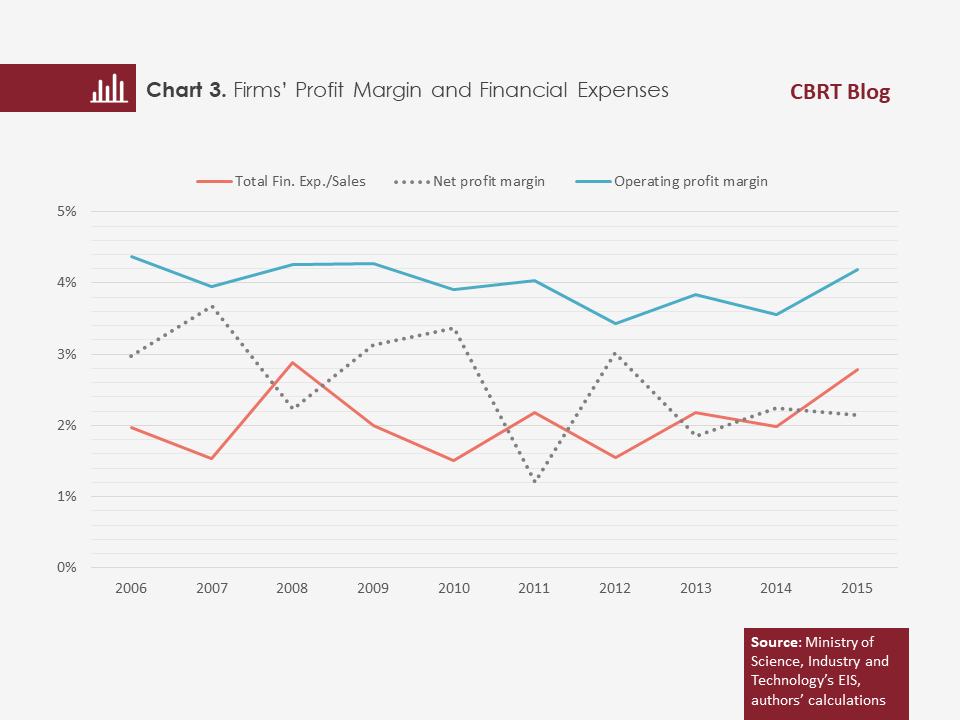
We calculate firms’ net profit margin as an indicator of firms’ savings rates, by employing micro data from the Entrepreneur Information System (EIS) within the Ministry of Science, Industry and Technology.[3] Despite the relatively stable course of firms’ average operating profit margin in the last 10-year period, firms’ net profit margin has been declining significantly since 2010 in particular. We can say that the fluctuation in macro indicators, the geopolitical developments and the exchange rate movements have been influential in this decline (Chart 3).
In this context, we do not observe any structural/behavioral changes that can explain the post-revision jump in domestic savings rates, neither in households’ nor in firms’ savings rates. Therefore, it is possible to attribute the post-revision rise in savings rates to the methodological change. Actually, the TURKSTAT had also announced that the escalation in savings rates originated from the increase in investments triggered by the revision. Particularly, the improvement in the measurement quality concerning the recently fast-growing construction sector and the expansion of the coverage area related to this sector are deemed the primary reasons for this increase.
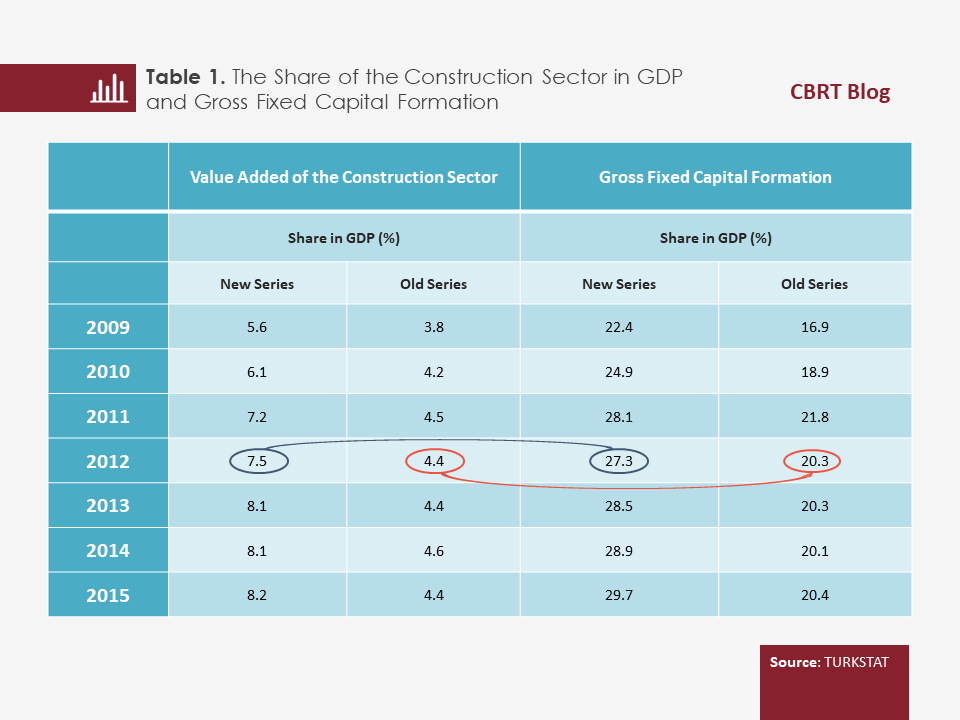
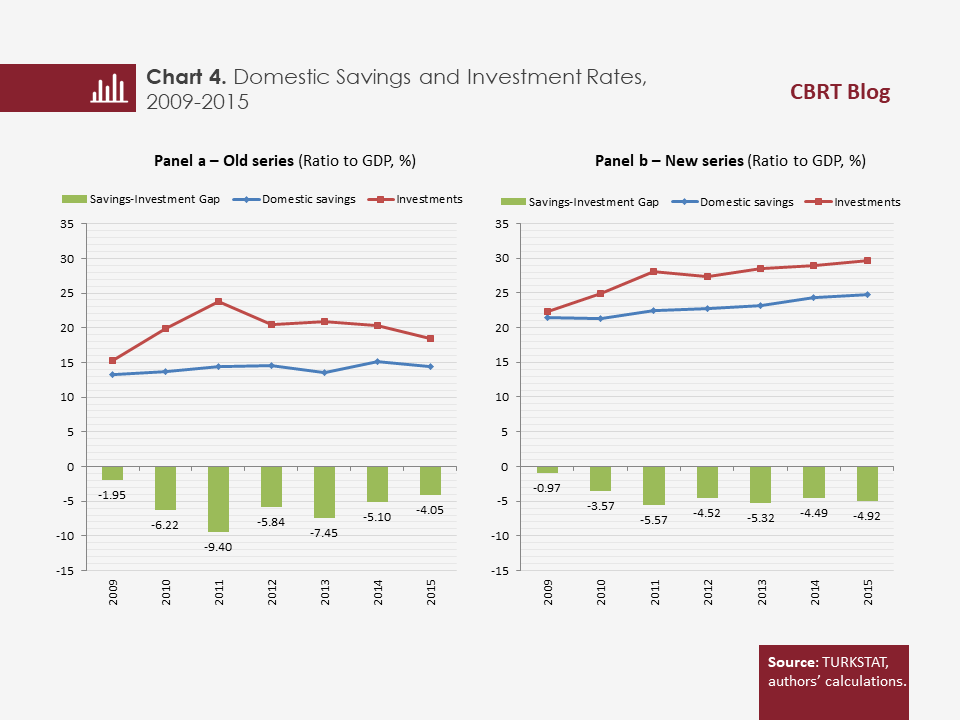
The value added of the construction sector surged after the revision (Table 1). In the meantime, the share of construction investments in national income also climbed significantly. The increased share of construction sector-driven gross fixed capital formation in national income caused domestic savings to be calculated at a higher rate in the new series compared to the old series and the gap between the new and old series to further widen over the years.
In sum, the post-revision rise stems from improvements in the measurement methodology, and it increases savings and investments at similar rates. In other words, the savings gap, which is defined as the difference between savings and investments, still lingers between 4 and 5 percent (Chart 4). Therefore, from an external balance perspective, the need for policies that will boost domestic savings and narrow the savings gap persists. In this respect, it is important that the effects of policies, including the developments after the introduction of the compulsory PPS, are closely monitored on the household side.
On the firm side, productivity-boosting regulations are a factor that will increase savings rates. Moreover, increasing the effectiveness of risk management for firms’ foreign currency indebtedness may contribute to achieving a more stable course in profitability and savings by reducing the exchange rate-driven volatility in financing costs.
The main reason why there is no significant change in the savings gap despite the rise in domestic savings rates is that we do not save at a sufficiently high rate to cover investments at such a level. Table 2 shows that in 2015, the investment rate in Turkey was slightly below the average of East Asian, Pacific and Upper-Middle Income Group countries but above the averages of other income groups. However, an analysis of savings rates during the same year reveals that Turkey’s savings rate remained below not only East Asian, Pacific and Upper-Middle Income Group countries but also the averages of Middle-Income Group, South Asian and even the Lower-Middle Income Group countries. None of these countries has a savings gap, whereas Turkey has one persistently.
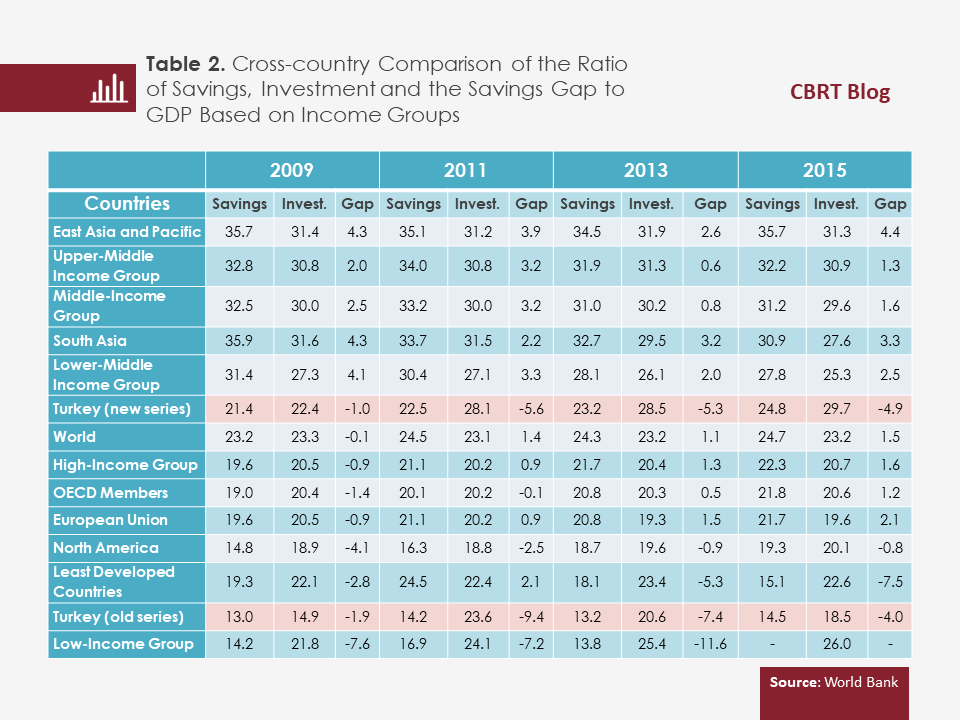
One of the main conclusions we can arrive at from Table 2 is that the country groups with an investment rate of around 30 percent have, in general, savings rates above 30 percent. This conclusion points to the ongoing importance of structural policies that will further increase the post-revision 25-percent savings rate. On the other hand, among the countries with a high investment rate, Turkey is one of those with the lowest savings rates, which also emphasizes the importance of the need for these policies. To conclude, the improvement observed in the savings rate in the aftermath of the national income revision does not eliminate the need for structural reforms in this area.
[1] In addition, the TURKSTAT prepared the Institutional Sector Accounts, which consist of Non-Financial Corporations, Financial Corporations, General Government, Households and Non-Profit Institutions Serving Households, for the first time for the years 2009-2015 and shared with the public the ratios of these sectors’ savings to GDP. In this way, the corporate sector’s savings rates calculated by the Ministry of Development in the previous period could be tracked in a breakdown by private companies and households.
[2] Household savings are calculated by deducting the consumption expenditures from the annual household disposable income found in surveys. It is possible to obtain household savings rates by taking the share of household savings in disposable income.
[3] In the literature, firms’ saving rates are calculated by deducting the dividends from net profit and dividing it by net sales. Since the EIS data do not include dividends, the net profit margin has been used instead of the savings rate. However, an analysis of previous studies suggests that these two series display similar movements (Ministry of Development, 2014).
Bibliography:
Ministry of Development (2014), Onuncu Kalkınma Planı Yurtiçi Tasarruflar Özel İhtisas Komisyonu Raporu (The Tenth Development Plan Special Commission Report on Domestic Savings) (in Turkish).