The share of the construction sector within national income and employment has recorded a steady increase in recent years. In terms of growth rates, the rise in value added in the construction sector across 2017 stood above the GDP growth rate. However, this trend changed due to the contraction in the last quarter of 2017 and the construction sector grew less than GDP in the first three quarters of 2018. Accordingly, the question arises of whether a supply surplus occurred in the housing sector. In this context, the aim of this study is to evaluate the supply-demand balance in the housing sector.
As a supply indicator, we use occupancy permits granted for new buildings for residential purposes. The first house sales serve as the demand indicator. 1 The analysis covering Turkey and three large provinces basically starts from 2013. 2 Turkey-wide analysis extends out to the third quarter of 2018, while the evaluation for the three large provinces is limited to the end of 2017 due to data constraints.
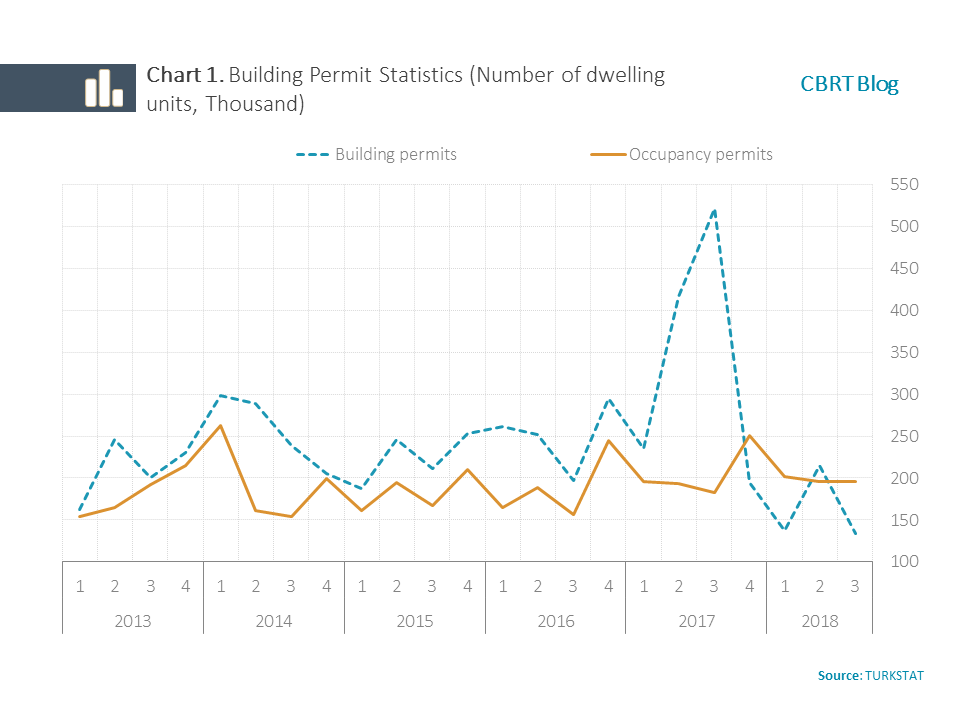
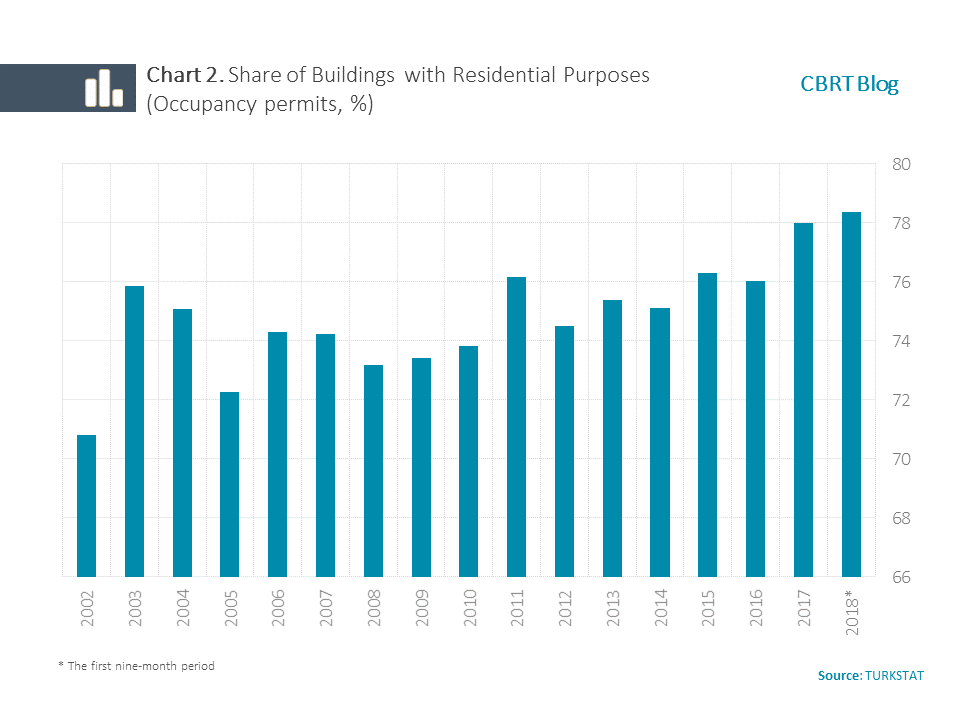
Before examining the supply-demand balance, a glance at supply-side developments will be useful. Construction permits registered a considerable increase in 2017, but this increase should not be expected to appear instantly in the housing supply (Chart 1). Thus, we believe that in evaluations on supply, taking occupancy permits into consideration rather than construction permits yields more credible results. 3 In addition, housing for residential purposes has a rather high share in total buildings (Chart 2).
Demand developments suggest that housing sales in 2017 reached almost the highest level of recent years with approximately 1.400,000. Particularly, the boost in housing sales in the first three quarters of 2017 is attributed to tax incentives that were provided by the government and expired in September.4 Although more than 1.37000,000 houses were sold in 2018, total sales recorded 2.4% decline in annual terms.
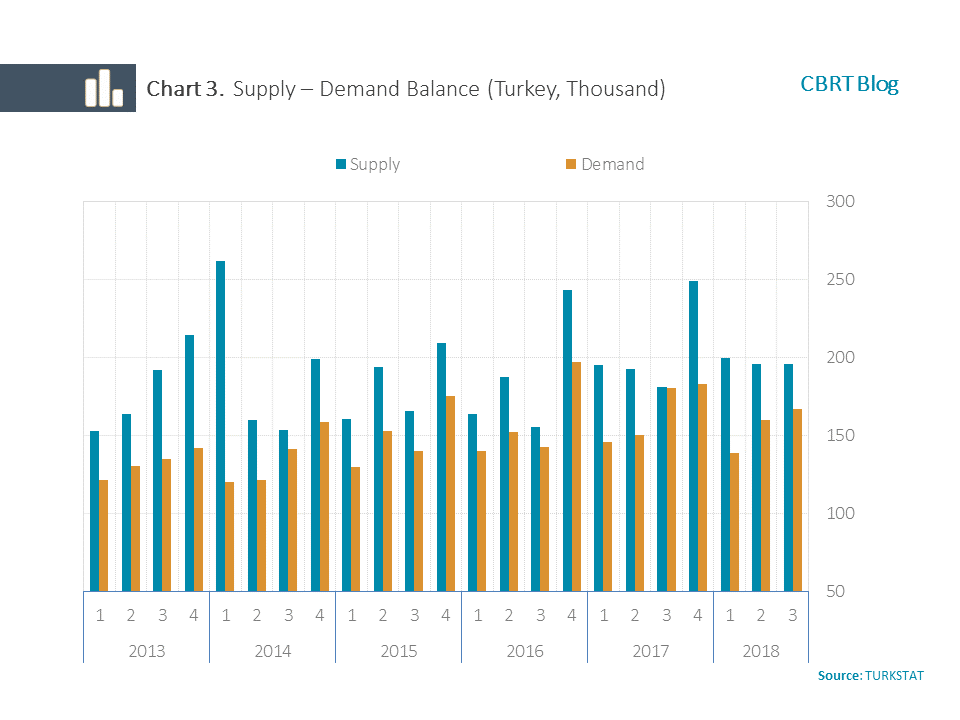
To monitor the trends of supply-demand balance, we subtract the first house sales from the number of occupancy permits (Chart 3). 5 This difference was around 158 units in 2017. The Turkey-wide analysis reveals that this difference decreased in 2015 and 2016, but recorded a mild increase in 2017 compared to the previous year. In the first nine months of 2018, the difference between supply and demand reached almost 125,000 and stood above the surplus that emerged in the same periods of past years which were marked by strong housing demand. On the other hand, we can claim that the housing supply may lose pace in the upcoming periods as hinted by the decline in construction permits in 2018 (Chart 1). Therefore, the supply surplus in the short term notwithstanding, closing of this supply-demand gap may be expected in the long-term.
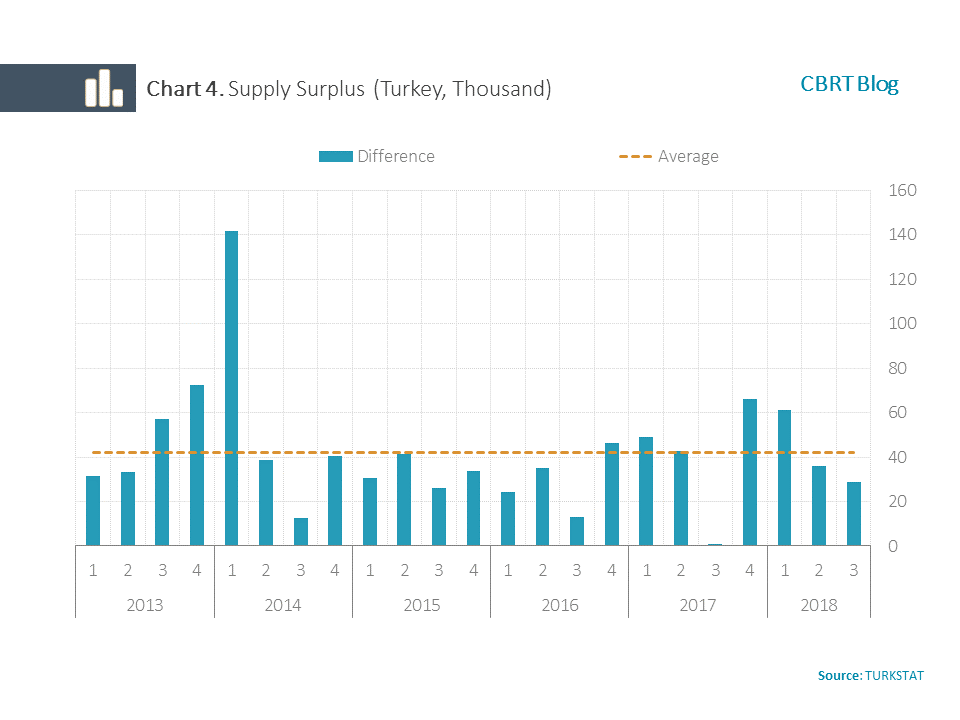
An analysis of the impact of incentives for the housing market on the supply-demand balance suggests that they were influential in the diminishing of the gap between supply and demand in the third quarter of 2017. However, this gap has hit high levels again since the last quarter of 2017, pointing out that the incentives brought housing demand forward (Chart 4). Fluctuations in financial markets in the third quarter of 2018 are thought to cause deterioration in households’ expectations and postponement of the housing demand.
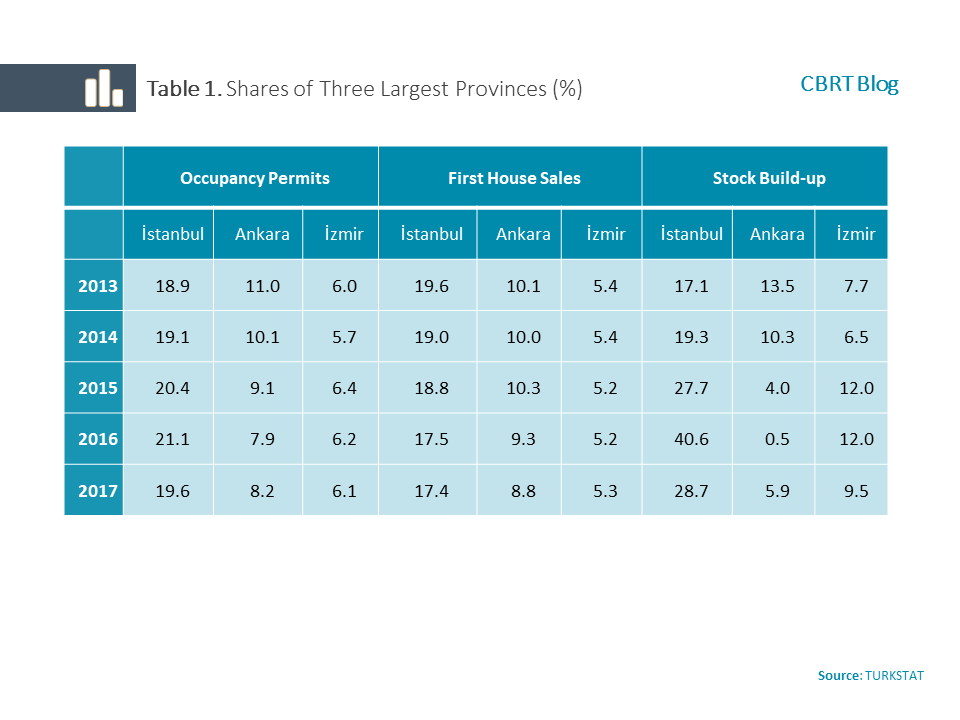
On a regional basis, the gap between supply and demand in the housing sector concentrated in the largest three provinces in Turkey. In the analyzed period, the largest share of supply surplus belongs to İstanbul. Particularly, 40.6% of the housing supply surplus of about 48,000 houses in 2016 across Turkey stemmed from İstanbul. Another thing worth noting is that the share of Ankara within total supply surplus in the 2013-2016 period decreased steadily. Despite being a smaller province, this ratio increased remarkably in İzmir (Table 1). 6
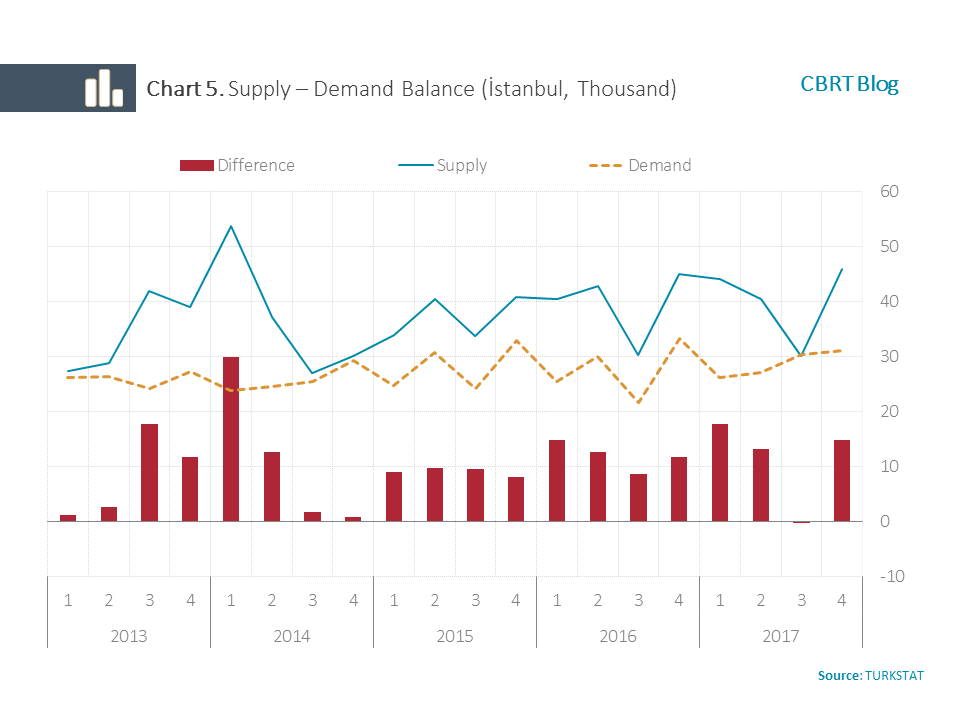
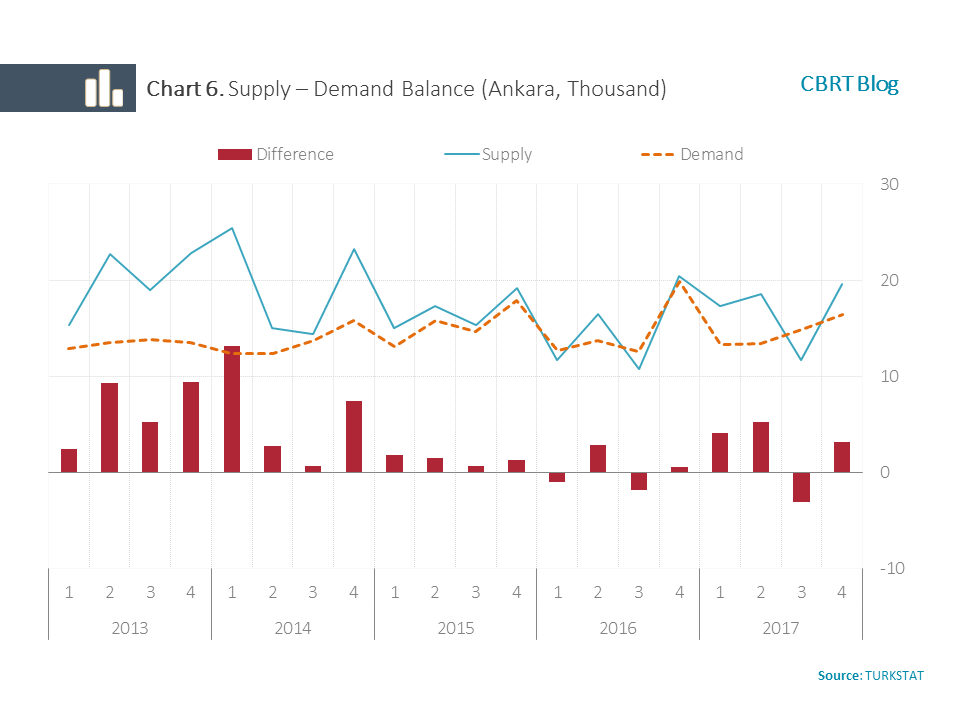
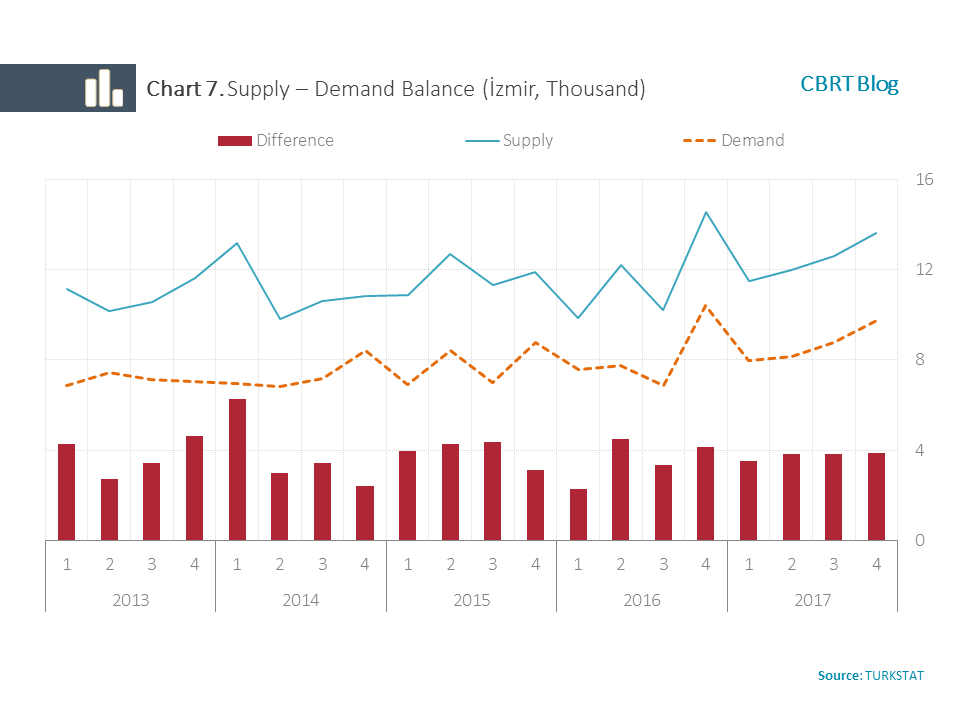
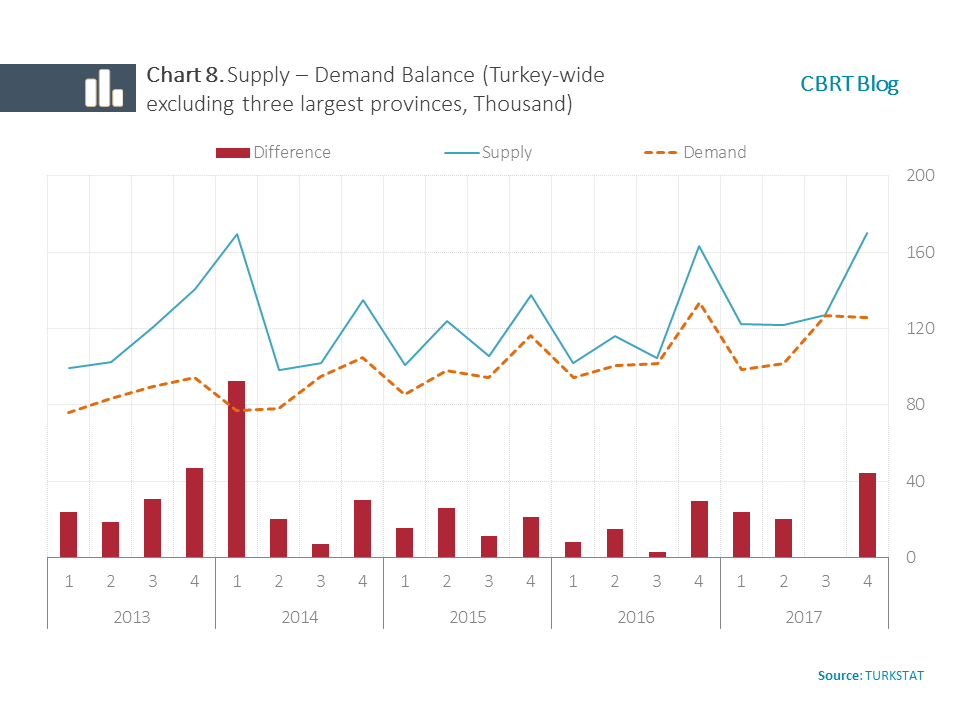
Housing supply-demand evaluation for the largest three provinces manifests quite different results (Charts 5-7). For example, a housing supply surplus occurred in all periods in İzmir and in all periods other than the third quarter of 2017 in İstanbul. On the other hand, the housing supply surplus in Ankara (around 65,000) is less than İstanbul (around 208,000) and İzmir (around 75,000) in the period of analysis from 2013 to 2017. Moreover, the positive effect of the incentive package exercised in the third quarter of 2017 contributed to the closing of the supply-demand gap, particularly in Ankara and İstanbul. Repetition of this analysis for the regions excluding the largest three provinces produces no gap between supply and demand in the third quarter of 2017, while the supply surplus grew considerably in the last quarter of the year (Chart 8).
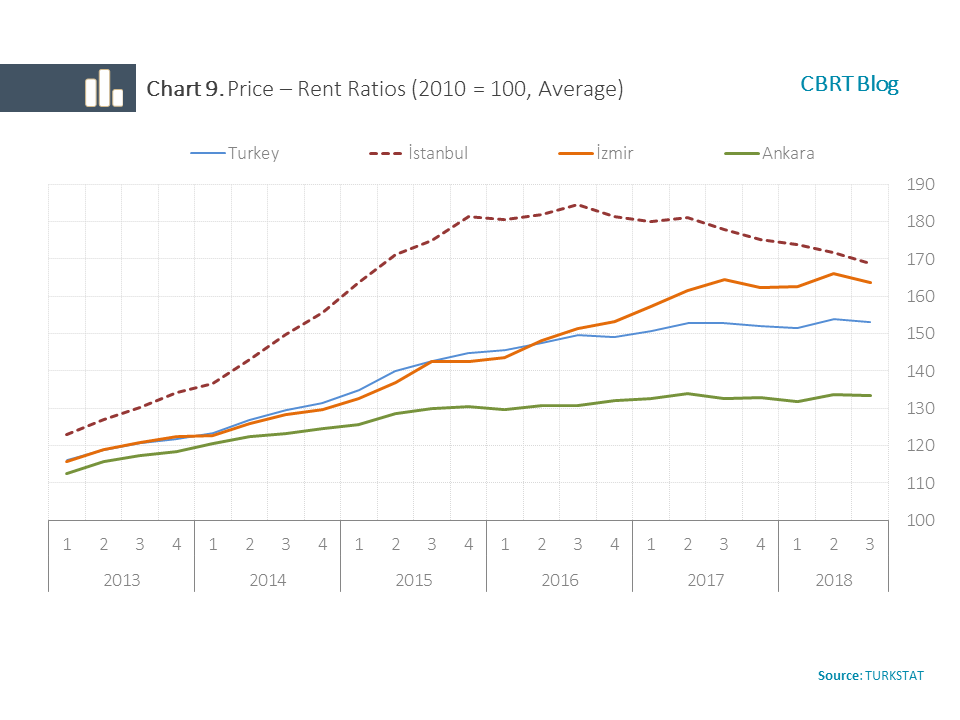
 Stock building in the housing sector may render housing investment more profitable by repressing prices and lowering price-rent ratios. 7 To evaluate the developments in relative price movements in Turkey, we can calculate the price-rent ratio that entails information about housing investment profitability.8 Region-based price-rent ratios can be obtained by dividing the CBRT housing price index into actual rent price index (Chart 9). Faster increase in housing prices compared to rents in past years indicates a downturn in housing investment profitability. 9 However, the price-rent ratio came to a halt in 2017 across Turkey. İstanbul in particular, which experienced booms in housing prices in past years, has recently seen a decline in the price-rent ratio. This is caused by the slowdown in housing prices since 2016 that fell below rent increases after recording upsurges for a long time in İstanbul. Accordingly, the recent decline in the price-rent ratio may contribute to the balancing of supply and demand in the housing sector.
In sum, the supply-demand balance gives us information about the stock buildup in the housing sector. The ratio of this difference to occupancy permits for the analyzed period is about 21%. This ratio points out that firms operating in the housing sector have a higher stock level than firms operating in other sectors. For example, current stock of finished products tendency from the CBRT Business Tendency Survey indicators hovers at much lower levels in this period. As the increase in stock building renders firms operating in the housing sector more sensitive against financial fluctuations, it needs to be monitored closely.
1 Due to the lack of data on the housing stock in Turkey, we can make the supply-demand balance evaluation by using flow variables in the analysis. Therefore, stock buildup in the housing market in past years could not be taken into account.
2 Housing sales data has been published monthly since 2013 by the Turkish Statistical Institute (TURKSTAT). First sale is the first time sale of a house by the company or person which took ownership by apartments/sharing access by apartments. Second hand sale means that a house sold by an owner, that has bought the house by first sale, to another person.
3 Construction permits must be received for the buildings for the start of construction activities. Occupancy permits must be received for buildings that are completely or partially constructed to permit habitation. Occupancy permits granted for new housings for residential purposes increased by 9.1% to about 818,000 on an annual basis in 2017. It became around 591,000 in the first nine months of 2018 and rose by 3.9% year-on-year.
4 The arrangement on the VAT payment of 1% on houses smaller than 150 square meters, and 8% for those larger than 150 square meters remained effective from 8 September 2016 to 30 September 2017. Moreover, title deed fees of 0.20% for houses and workplaces were reduced to 0.15% from March 2017 to 30 September 2017.
5 For buildings included in urban transformation, occupancy permits are taken. Therefore, occupancy permits that we refer to as indicators of supply include not only newly-constructed buildings but also buildings subject to urban transformation. This can create an upside bias on the supply indicator.
6 Three largest provinces are analyzed in this study. It should be noted that supply surplus can vary across both geographical regions as well as housing features. For example, supply surplus may concentrate in luxurious houses. However, since no data are available in this detail, evaluations cannot be made to this extent.
7 Past studies in literature indicate that both relative housing and rent prices and social and demographic features are influential in households’ preferences for buying or renting houses (Goodman 1988 and 1990). According to our calculations, when other variables are kept constant for Turkey, a negative but weak relationship occurs between price-rent ratio and supply-demand difference in the long term.
8 TURKSTAT releases the actual rent price index, a sub-item of the consumer price index (CPI) for 26 regions at level 2 of the Statistical Classification of Regional Units (NUTS2). Similarly, housing price indices are released for these 26 geographical regions by the Central Bank of the Republic of Turkey (CBRT).
9 This indicates an extended time for return on housing investment. For details, please refer to: http://www.tcmbblog.org/wps/wcm/connect/blog/en/main%20menu/analyses/length-of-time-for-return-on-housing-investments.
References
Goodman, Allen C. (1988), “An Econometric Model of Housing Price, Permanent Income, Tenure Choice and Housing Demand”, Journal of Urban Economics, vol. 23, pp. 327-353.
(1990), “Demographics of Individual Housing Demand”, Regional Science and Urban Economics, vol. 20, pp. 83-102.