
The financial soundness of a firm is of vital importance not only for the sector in which it operates but also for the financial system and the entire economy. A firm experiencing financial distress can damage the financial structure of its lenders, shareholders and their lenders, and in turn cause losses throughout the economy as a whole depending on the size of the firm's operations. For this reason, for many years analysts have been trying to measure the financial soundness of firms through their financial statements and to anticipate any possible defaults.
For such financial risk analysis, several indicators and ratios can be obtained from the financial statements of firms. Each indicator measures the firm's position in terms of metrics such as liquidity, profitability or indebtedness. However, there is no single indicator that can test the firm's overall financial strength or financial distress level. For this reason, some composite index measures have been produced to rate the financial risk level of firms comprehensively (Altman Z-score, 1968, Deakin, 1972, Ohlson O-score, 1980, Zmijewski, 1984). In these rating methods, various ratios such as profitability, leverage or liquidity are weighted using statistical methods and converted into a single score. The Z-score developed and updated over time by Altman (1968) using Multivariate Discriminant Analysis (MDA) is the most prevalent composite risk indicator in corporate finance literature. Our study introduces a new index score, named as the MFA-score (Multivariate Firm Assessment), that is created using the MDA for the real sector firms traded on Borsa Istanbul and analyzes the development of this score over time.
Basically, the MDA method gives us a linear equation that discriminates one year prior certain balance sheet ratios of firms that have experienced financial distress and those ratios of firms that have remained financially strong in the same period. While modelling the MFA score, we have selected the 7 ratios that we believe to best reflect Turkish firms and most accurately discriminate between distressed and sound firms among several ratios that are commonly used in the literature. These ratios are depicted in Table 1.
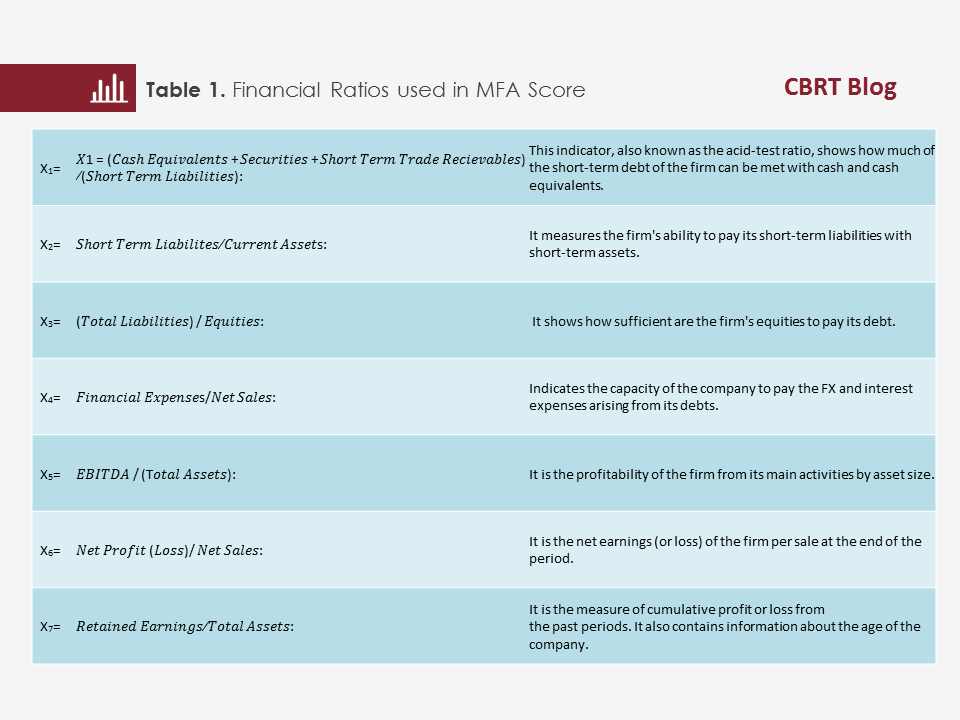
This study uses the ratios in Table 1 to analyze the degree of discrepancy between 54 firms that experienced financial distress between 2001 and 2016 and 54 other firms bearing similar peculiarities but that remained financially sound.[1] After applying the MDA, the equation and coefficients that best succeeded in determining this discrimination with the smallest margin of error were calculated.[2] The model’s standardized coefficients are shown in Table 2.[3]
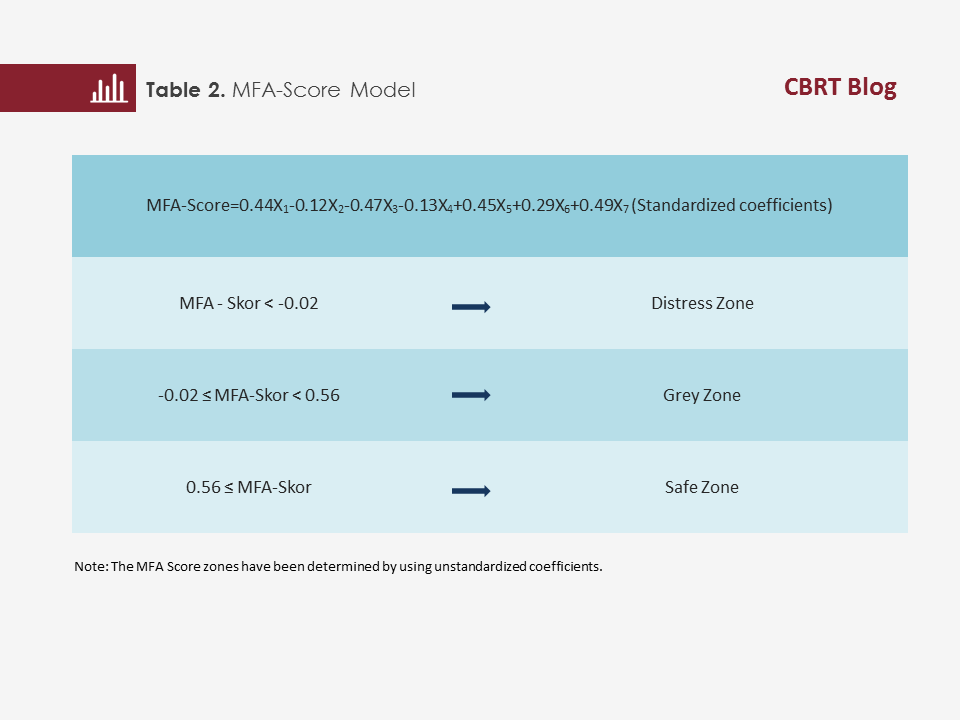
The signs of the coefficients are consistent with the expectations and in line with economic intuitions. When the standardized coefficients are examined, main determinants of a firm's financial distress or overall financial strength are found to be the firm's cash position, total debt level, EBITDA, and retained earnings. Accordingly, for 108 firms, the financial distress threshold was determined as -0.02, which minimizes the sum of Type 1 and Type 2 errors. The median MFA-score of 0.556 is selected as the second threshold value[4]. Therefore, if a firm's MFA-score is lower than -0.02 (distress zone), the firm is likely to experience financial distress in one year. If it is between -0.02 and 0.56 (gray zone) the firm has a low probability of experiencing financial distress, and if it is greater than 0.56, the firm is financially sound (safe zone).
The median of the MFA scores of nearly 230 non-financial firms that were quoted on the BIST are presented in Chart 1 and Chart 2.[5] The graphs show that the MFA scores move in line with GDP growth and inversely with the FX basket rate growth.[6] The significant correlation with these two important macro variables indicates that the model is successful in detecting the effects of macro-economic developments on the firms’ balance sheets.
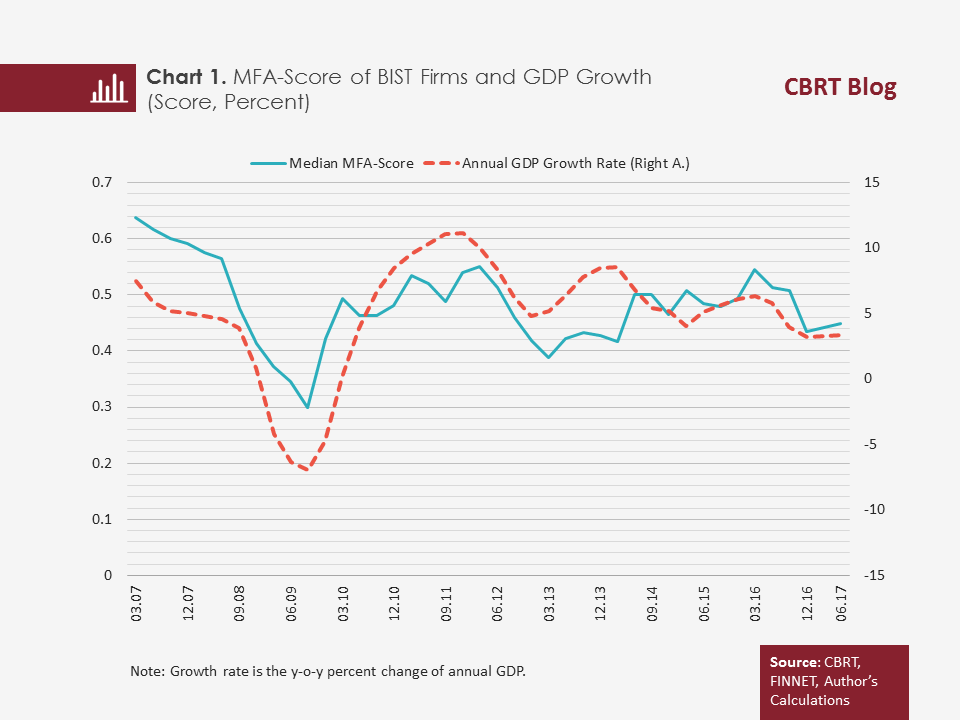
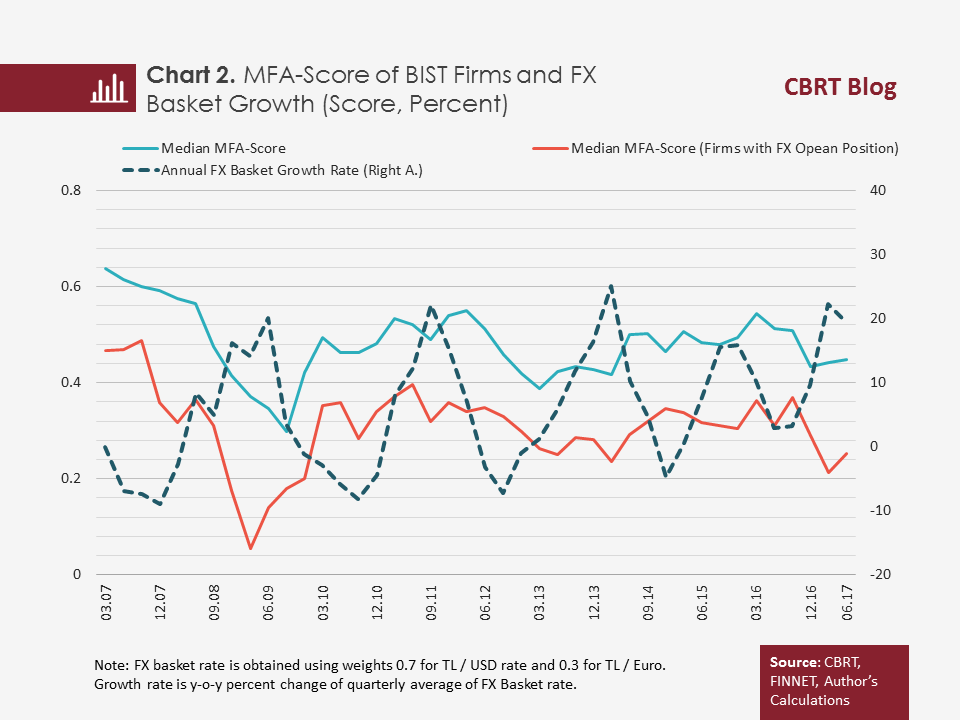
An analysis of the median and mean MFA-scores over time reveals that the score never- even during the global crisis- fell below the distress threshold value of -0.02 and moved within the grey zone boundaries. The MFA-score, which fell sharply during the global crisis, remained low throughout 2013 due to the slowdown in GDP growth at the end of 2012 and rising volatility in the wake of the Fed tapering in 2013. The MFA-score, which rose in the following period, declined from the last quarter of 2016 due to the increasing volatility in exchange rates. Another detail observed in the chart is that firms with open FX positions have lower MFA-scores than other firms and their reactions to macro developments are more manifest.[7] Particularly during the global crisis and the recent fluctuations, the drop in the scores of firms with open positions has been sharper.
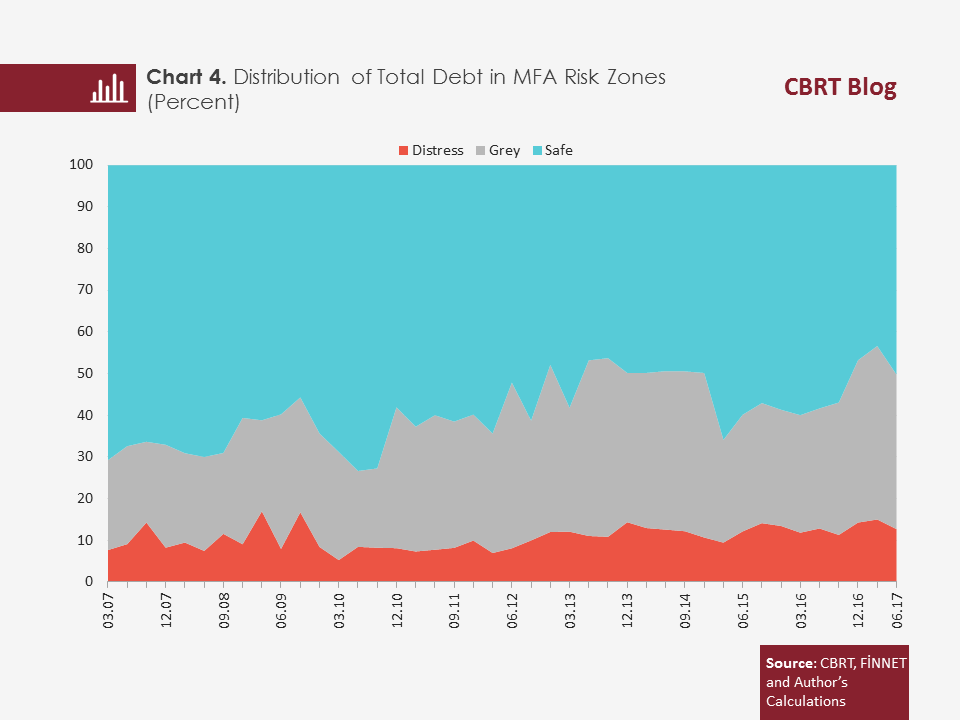
How much of the firms' debt is concentrated in companies that are more likely to experience financial distress is a critical question for the financial risk of the real sector. In the IMF reports (2016), the ratio debts of firms with interest coverage ratio under a certain threshold (risky firm) to the total debt of firms is used as the criterion of real sector financial risk (debt-at-risk). With the MFA score, it is possible to define a broader and more comprehensive risk indicator by calculating the debt share of firms in the distress zone in the total debt. According to this measure, it is observed that the share of risky firm debt is around 10 percent, and that most of the debt is concentrated in financially strong firms (Chart 4).
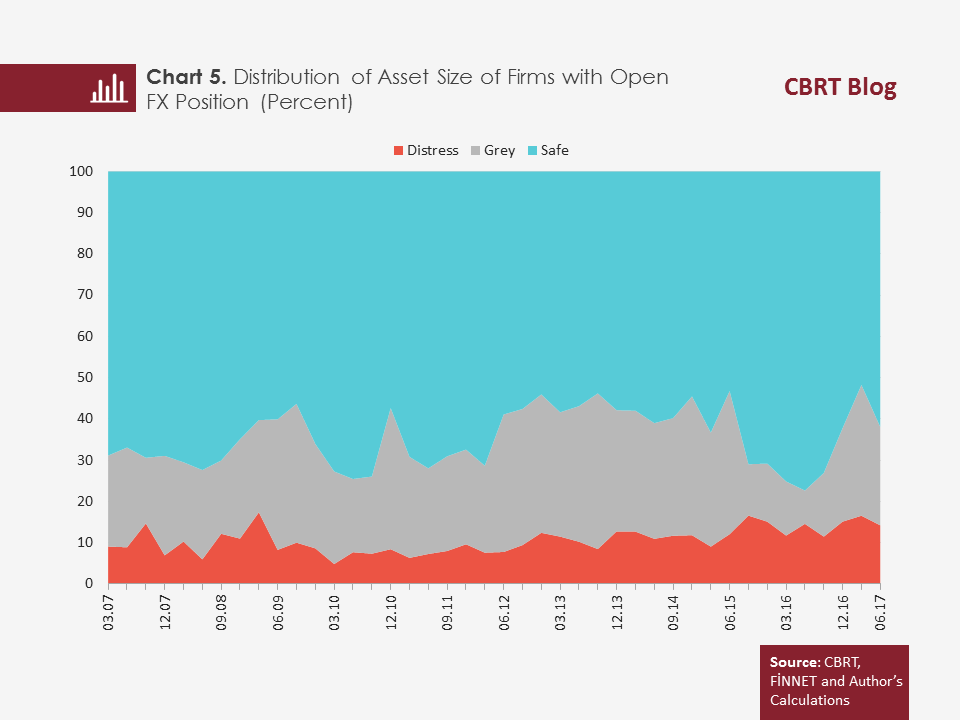
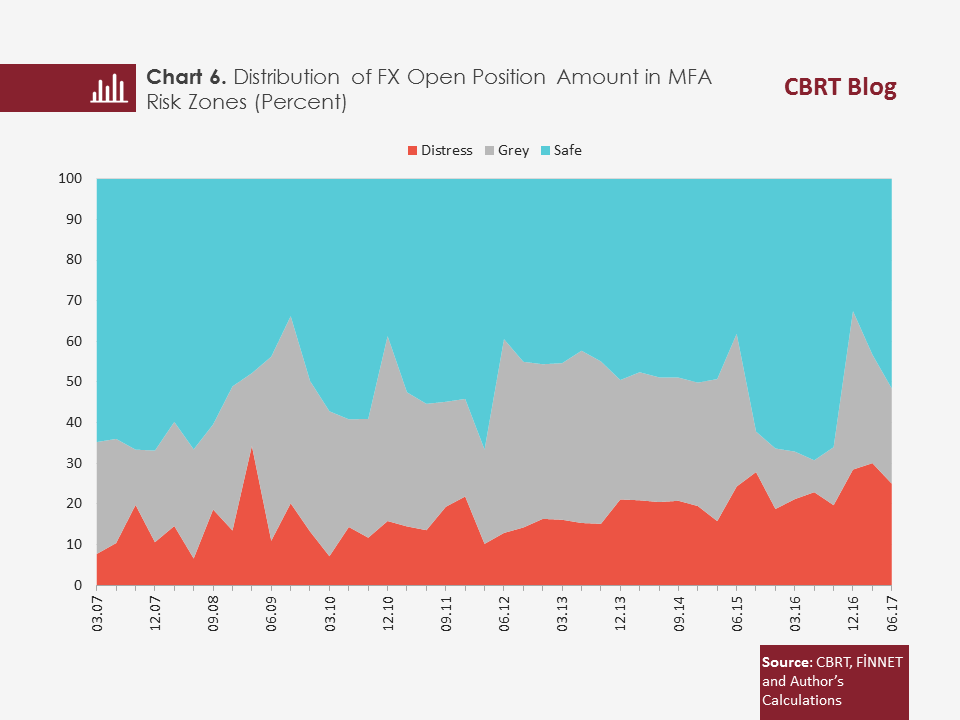
A look into data of firms with open FX positions reveals that asset share of firms in the distressed zone is low (Chart 5). Moreover, firms with open positions generally have solid balance sheet structure and there has been an increase in the grey zone recently. The share of the amount of open position held by the firms in distress zone is around 20-25 percent while most part of the open position is concentrated in the safe zone (Chart 6). Although there has been some move from the safe zone towards the grey zone as of 2016Q3, transition to the distress zone has been rather limited. In other words, most of the open position belongs to financially sound firms.
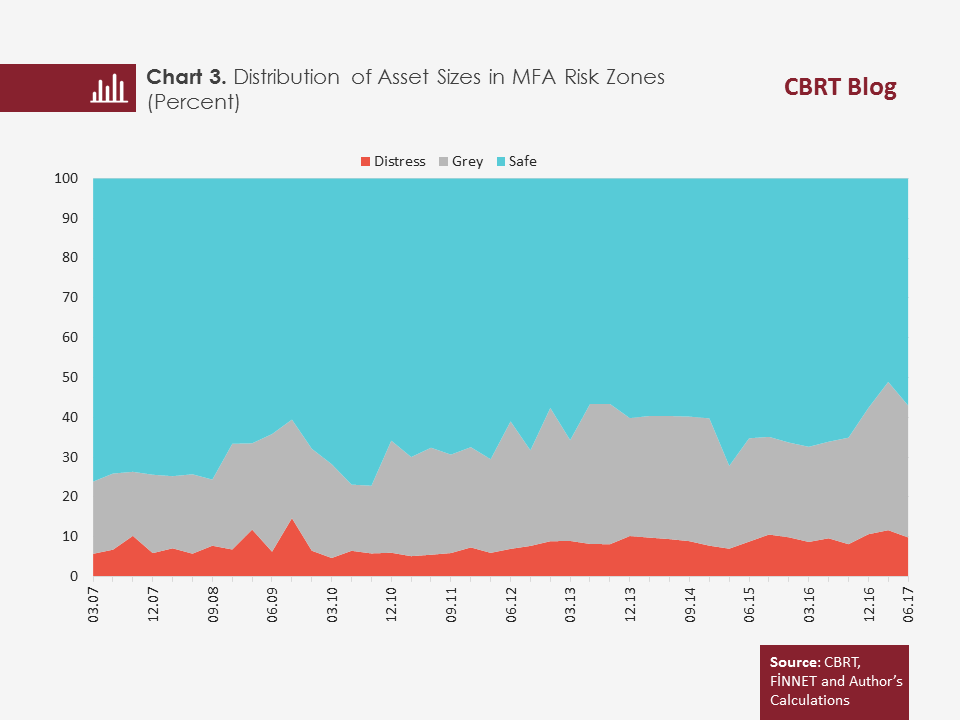
To sum up, in this study, the MFA-score, which measures the firm’s financial soundness with a high predictive power, was developed by using the balance sheet data of the real sector firms quoted on the BIST. As a result of our analysis, we found that distressed firms have a small share in terms of asset size, meanwhile, the firm debt and FX open position mostly concentrate in firms that are financially sound.
[1] In this study, the criteria for financial distress are exiting the stock market due to financial troubles, falling into the watch list market in Borsa Istanbul, creditors filing a bankruptcy petition, a bankruptcy declaration by firms, and having negative equity in the balance sheet. At the end of the evaluation process, it was found out that 54 firms met the financial distress criteria.
[2] The model performance is measured as the percentage of successful predictions of financial strength or distress of firms at time t by looking at the balance sheets of firms in time t-1.The model, which was 91 percent successful in making correct predictions, shows that the prediction performance is quite high.
[3] Standardization is derived by dividing the difference between the data and the average value of the series that the data belongs to by the standard error. Thus, the impact of coefficients on financial soundness becomes comparable. Each coefficient shows the impact of one standard deviation increase in the related variable on the MFA-score.
[4] While determining the optimal threshold value for financial distress, the ROC (Receiver Operating Curve) analysis that is widely used in determining threshold value over the sample in medical biochemistry literature has been used. This analysis finds the threshold value that minimizes type 1 and type 2 errors.
[5] Among firms quoted on BIST, financial companies, conglomerates and sport companies have been excluded. There are 236 firms as of 2017Q1 and 214 firms as of 2007Q1. There are data of 360 firms in total. In 2017, the total annual sales of the sample constitute nearly 15% of GDP in Turkey. There are 360 different types of firm data. The total annual sales of these companies constitute 15% of GDP in Turkey.
[6] In quarterly terms between 2007and 2017, the correlation of MFA score with y-o-y growth rate of annual GDP is 0.57 and the correlation of MFA score with y-o-y exchange rate basket is -0.48.
[7] The correlation between the median MFA-score and exchange rate basket of firms with open positions has been calculated as – 0.54.
References:
Altman, E. I. (1968). Financial Ratios, Discriminant Analysis and the Prediction of Corporate Bankruptcy, The Journal of Finance, 23(4): 589-609.
Ohlson, J. A. (1980). Financial Ratios and the Probabilistic Prediction of Bankruptcy, Journal of Accounting Research, 18: 109 – 131
Zmijewski, M. E. (1984). Methodological Issues Related to the Estimation of Financial Distress Prediction Models, Journal of Accounting Research, 22: 59 – 82
IMF. (2016). “Global Financial Stability Report”, Washington